
















Copyright: ©Author(s) 2026.
World J Gastrointest Oncol. Nov 15, 2026; 18(11): 123356
Published online Nov 15, 2026. doi: 10.4251/wjgo.123356
Published online Nov 15, 2026. doi: 10.4251/wjgo.123356
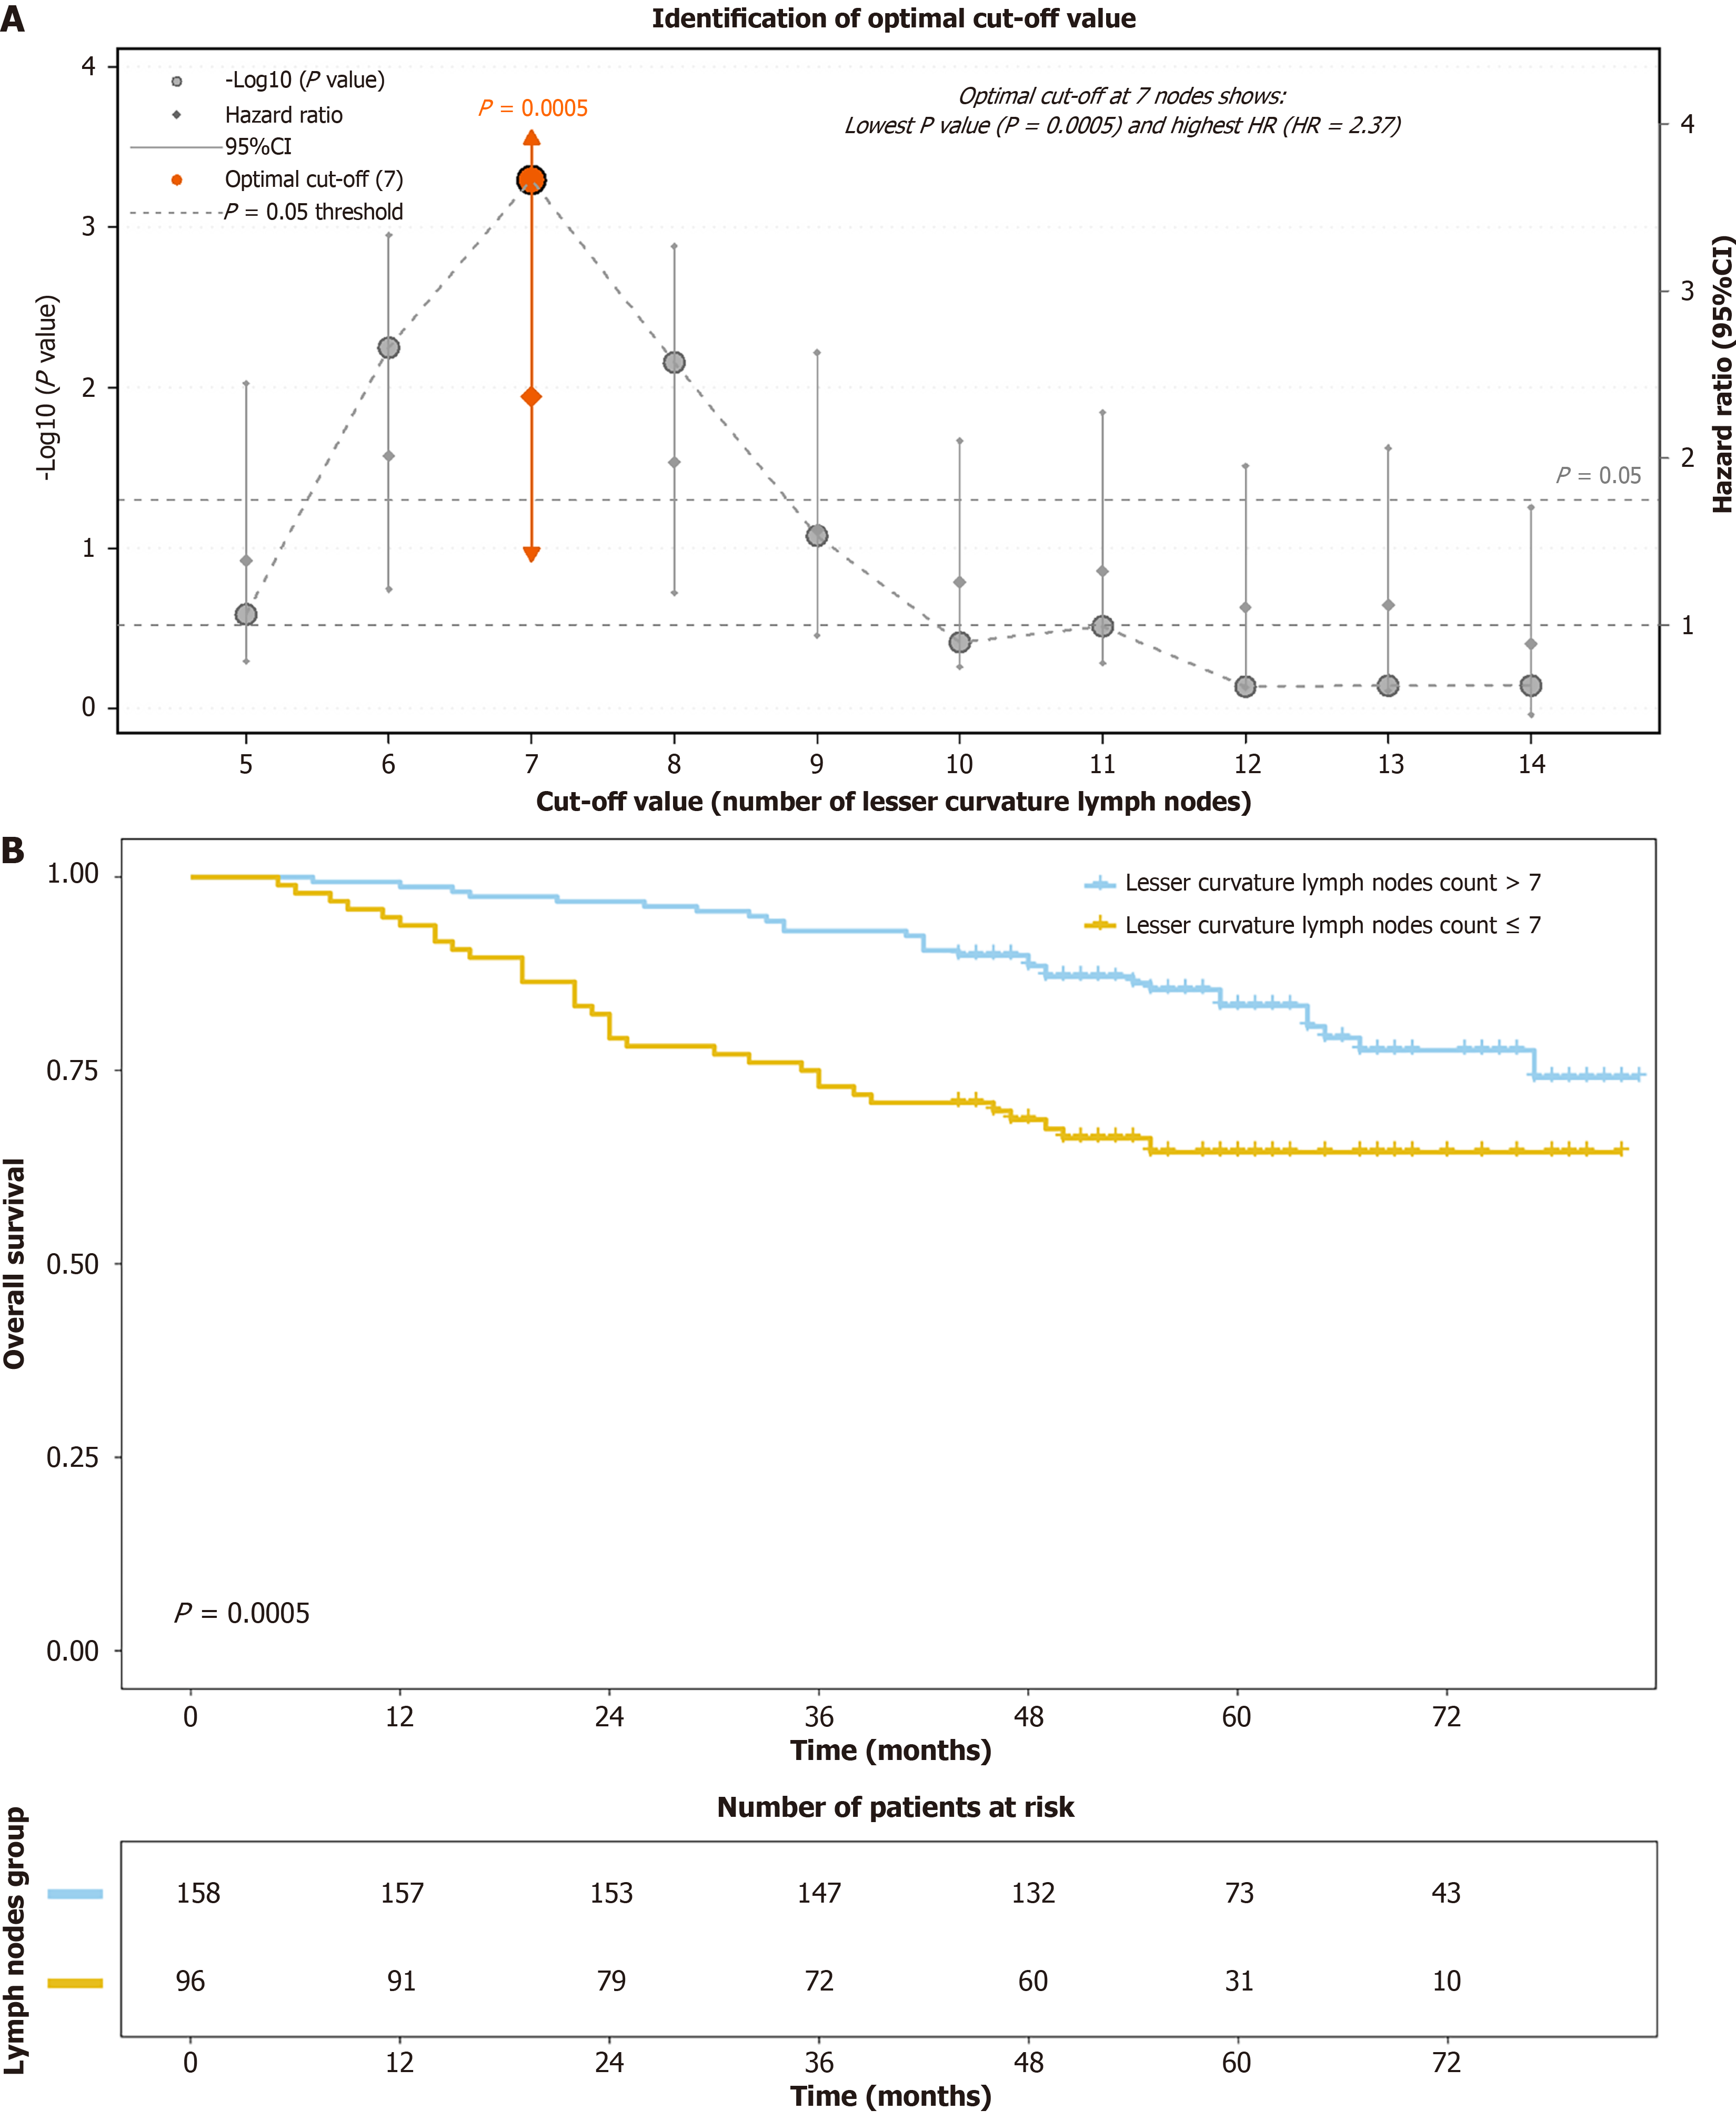
Figure 2 Determination of the optimal cutoff for lesser curvature lymph node count and its prognostic validation.
A: Systematic evaluation of survival differences across candidate cutoff values (5-14 retrieved lymph nodes). The primary Y-axis (left) represents the statistical significance of the log-rank test expressed as -log10(P-value). Higher values on the -log10(P-value) scale correspond to greater statistical significance. The secondary Y-axis (right) shows the corresponding hazard ratio and 95% confidence interval derived from univariate Cox regression analysis for each cutoff; B: Kaplan-Meier overall survival curves for the entire cohort stratified by the optimal cutoff (≤ 7 vs > 7 retrieved lesser curvature lymph nodes).
- Citation: Chen PF, Qian JJ, Zhang L, Chen ZM, Han WX. Prognostic impact of lesser curvature lymph node count in stage I/II gastric cancer: A retrospective study. World J Gastrointest Oncol 2026; 18(11): 123356
- URL: https://www.wjgnet.com/1948-5204/full/v18/i11/123356.htm
- DOI: https://dx.doi.org/10.4251/wjgo.123356