
















Copyright: ©Author(s) 2026.
World J Gastrointest Oncol. Nov 15, 2026; 18(11): 123321
Published online Nov 15, 2026. doi: 10.4251/wjgo.123321
Published online Nov 15, 2026. doi: 10.4251/wjgo.123321
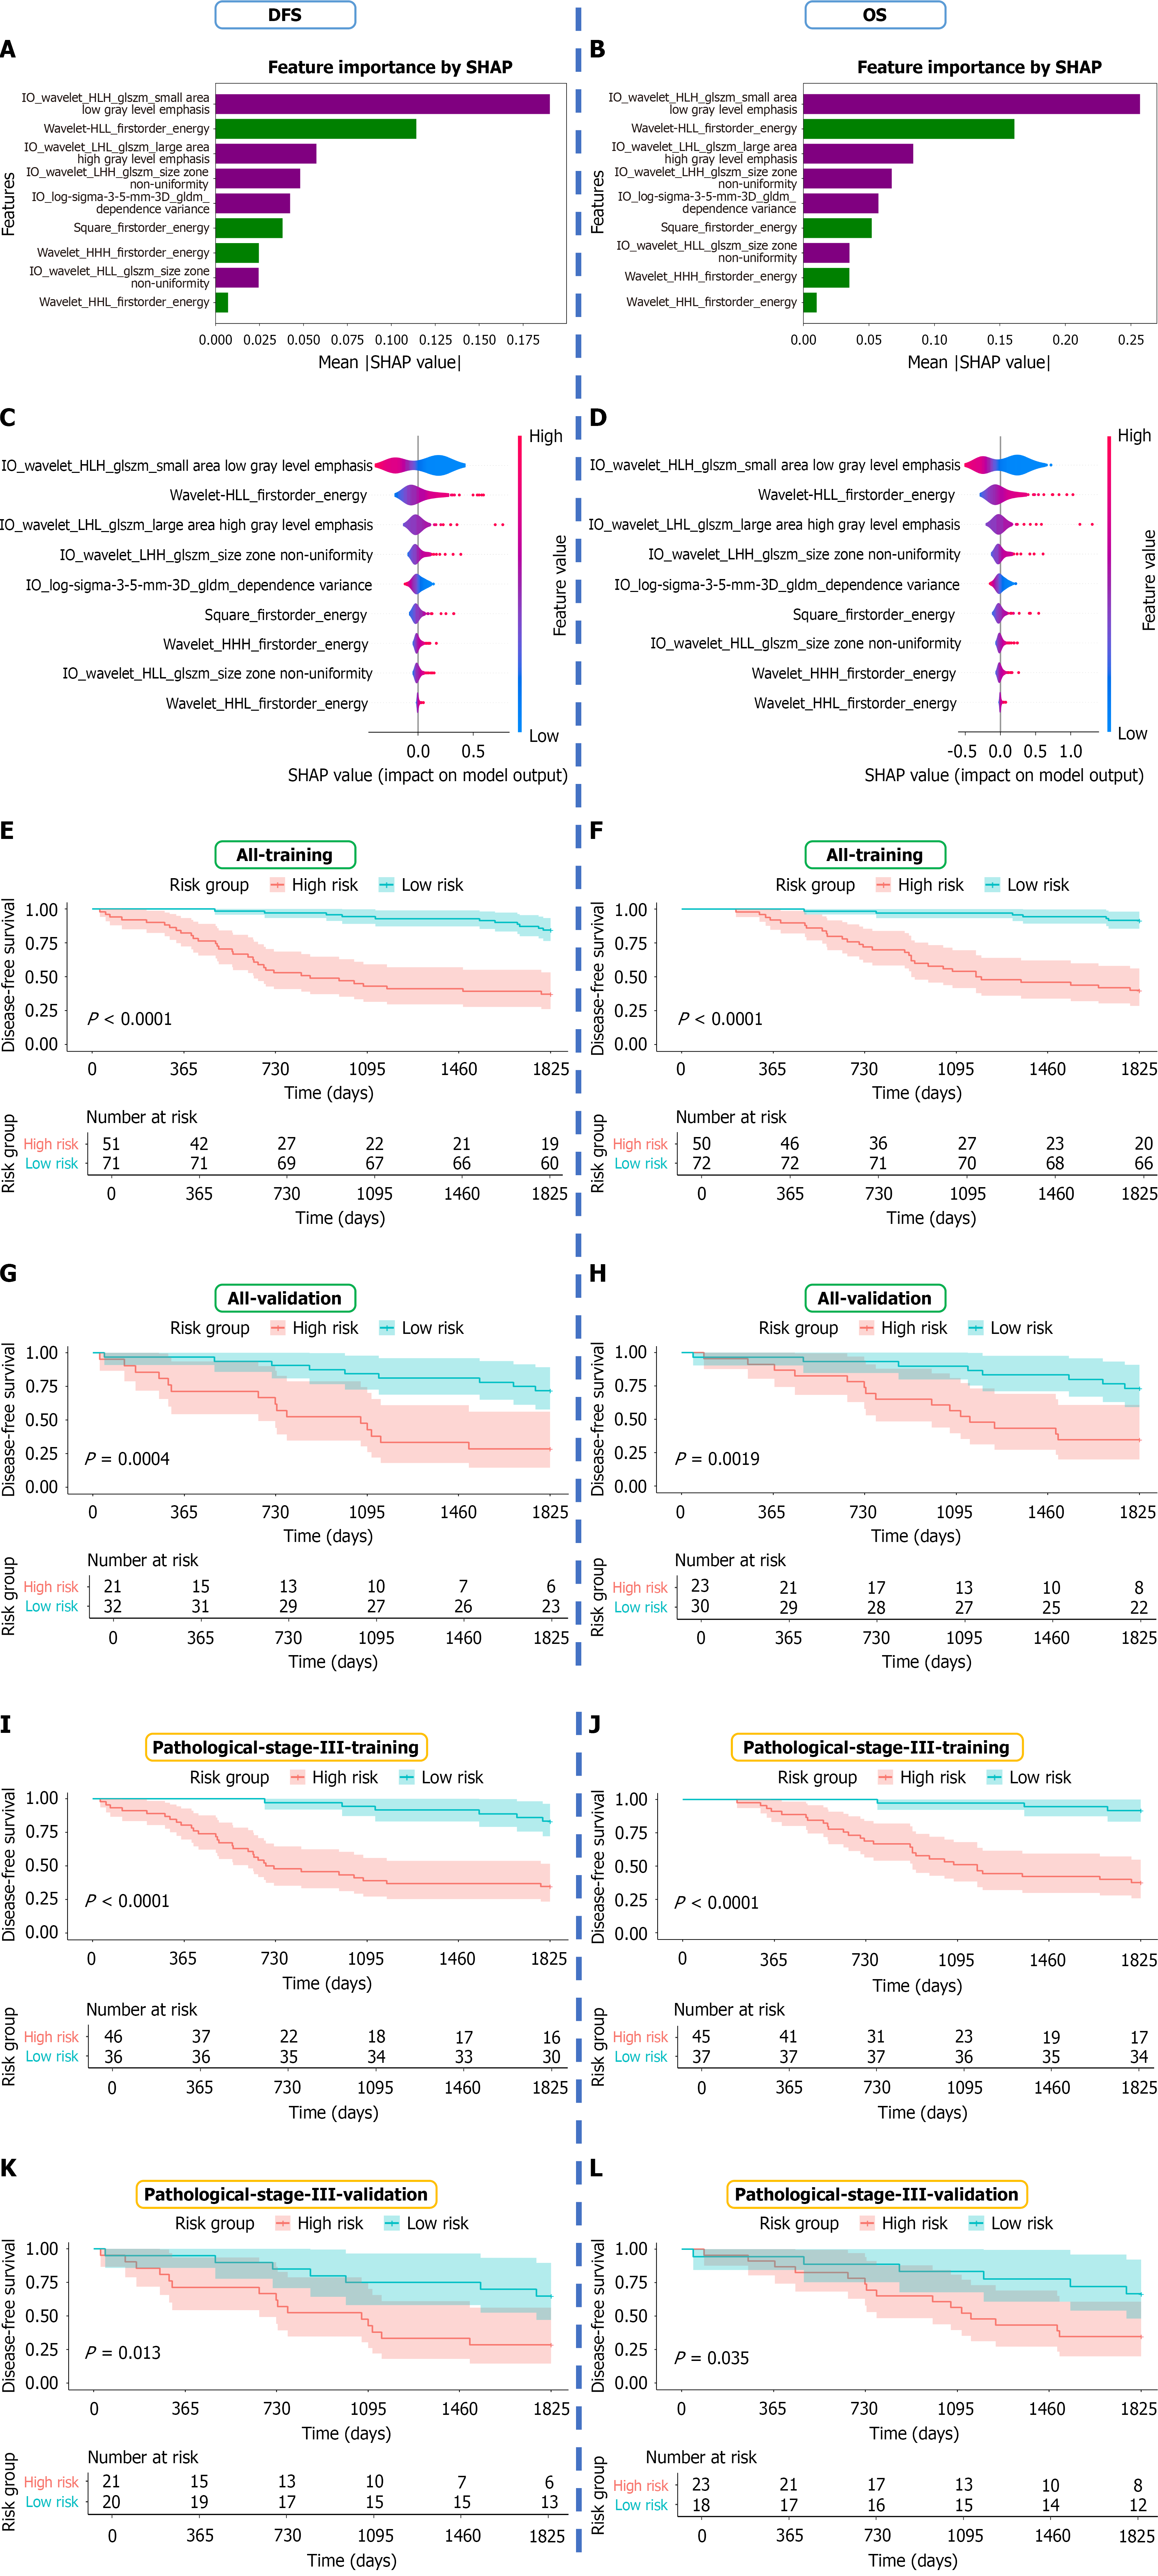
Figure 2 Feature contribution and Kaplan-Meier risk stratification of prognostic models.
A and B: Overall contribution of radiomic features to disease-free survival/overall survival prediction quantified by mean absolute SHapley Additive exPlanations values; C and D: Magnitude and direction of feature impact on model output visualized via SHapley Additive exPlanations summary plots; E-H: Kaplan-Meier curves of high- and low-risk subgroups among all patients in the training and validation sets; I-L: Kaplan-Meier curves of high- and low-risk subgroups among pathological stage III patients in the training and validation sets. DFS: Disease-free survival; OS: Overall survival.
- Citation: Liu A, Li M, You Y, Gao L, Xu XS, Li Y, Liu J, Li Y, Zhang ZD, Yang L. Preoperative dual-energy computed tomography radiomics for prognosis of advanced gastric adenocarcinoma. World J Gastrointest Oncol 2026; 18(11): 123321
- URL: https://www.wjgnet.com/1948-5204/full/v18/i11/123321.htm
- DOI: https://dx.doi.org/10.4251/wjgo.123321