
















Copyright: ©Author(s) 2026.
World J Gastrointest Oncol. Oct 15, 2026; 18(10): 124211
Published online Oct 15, 2026. doi: 10.4251/wjgo.124211
Published online Oct 15, 2026. doi: 10.4251/wjgo.124211
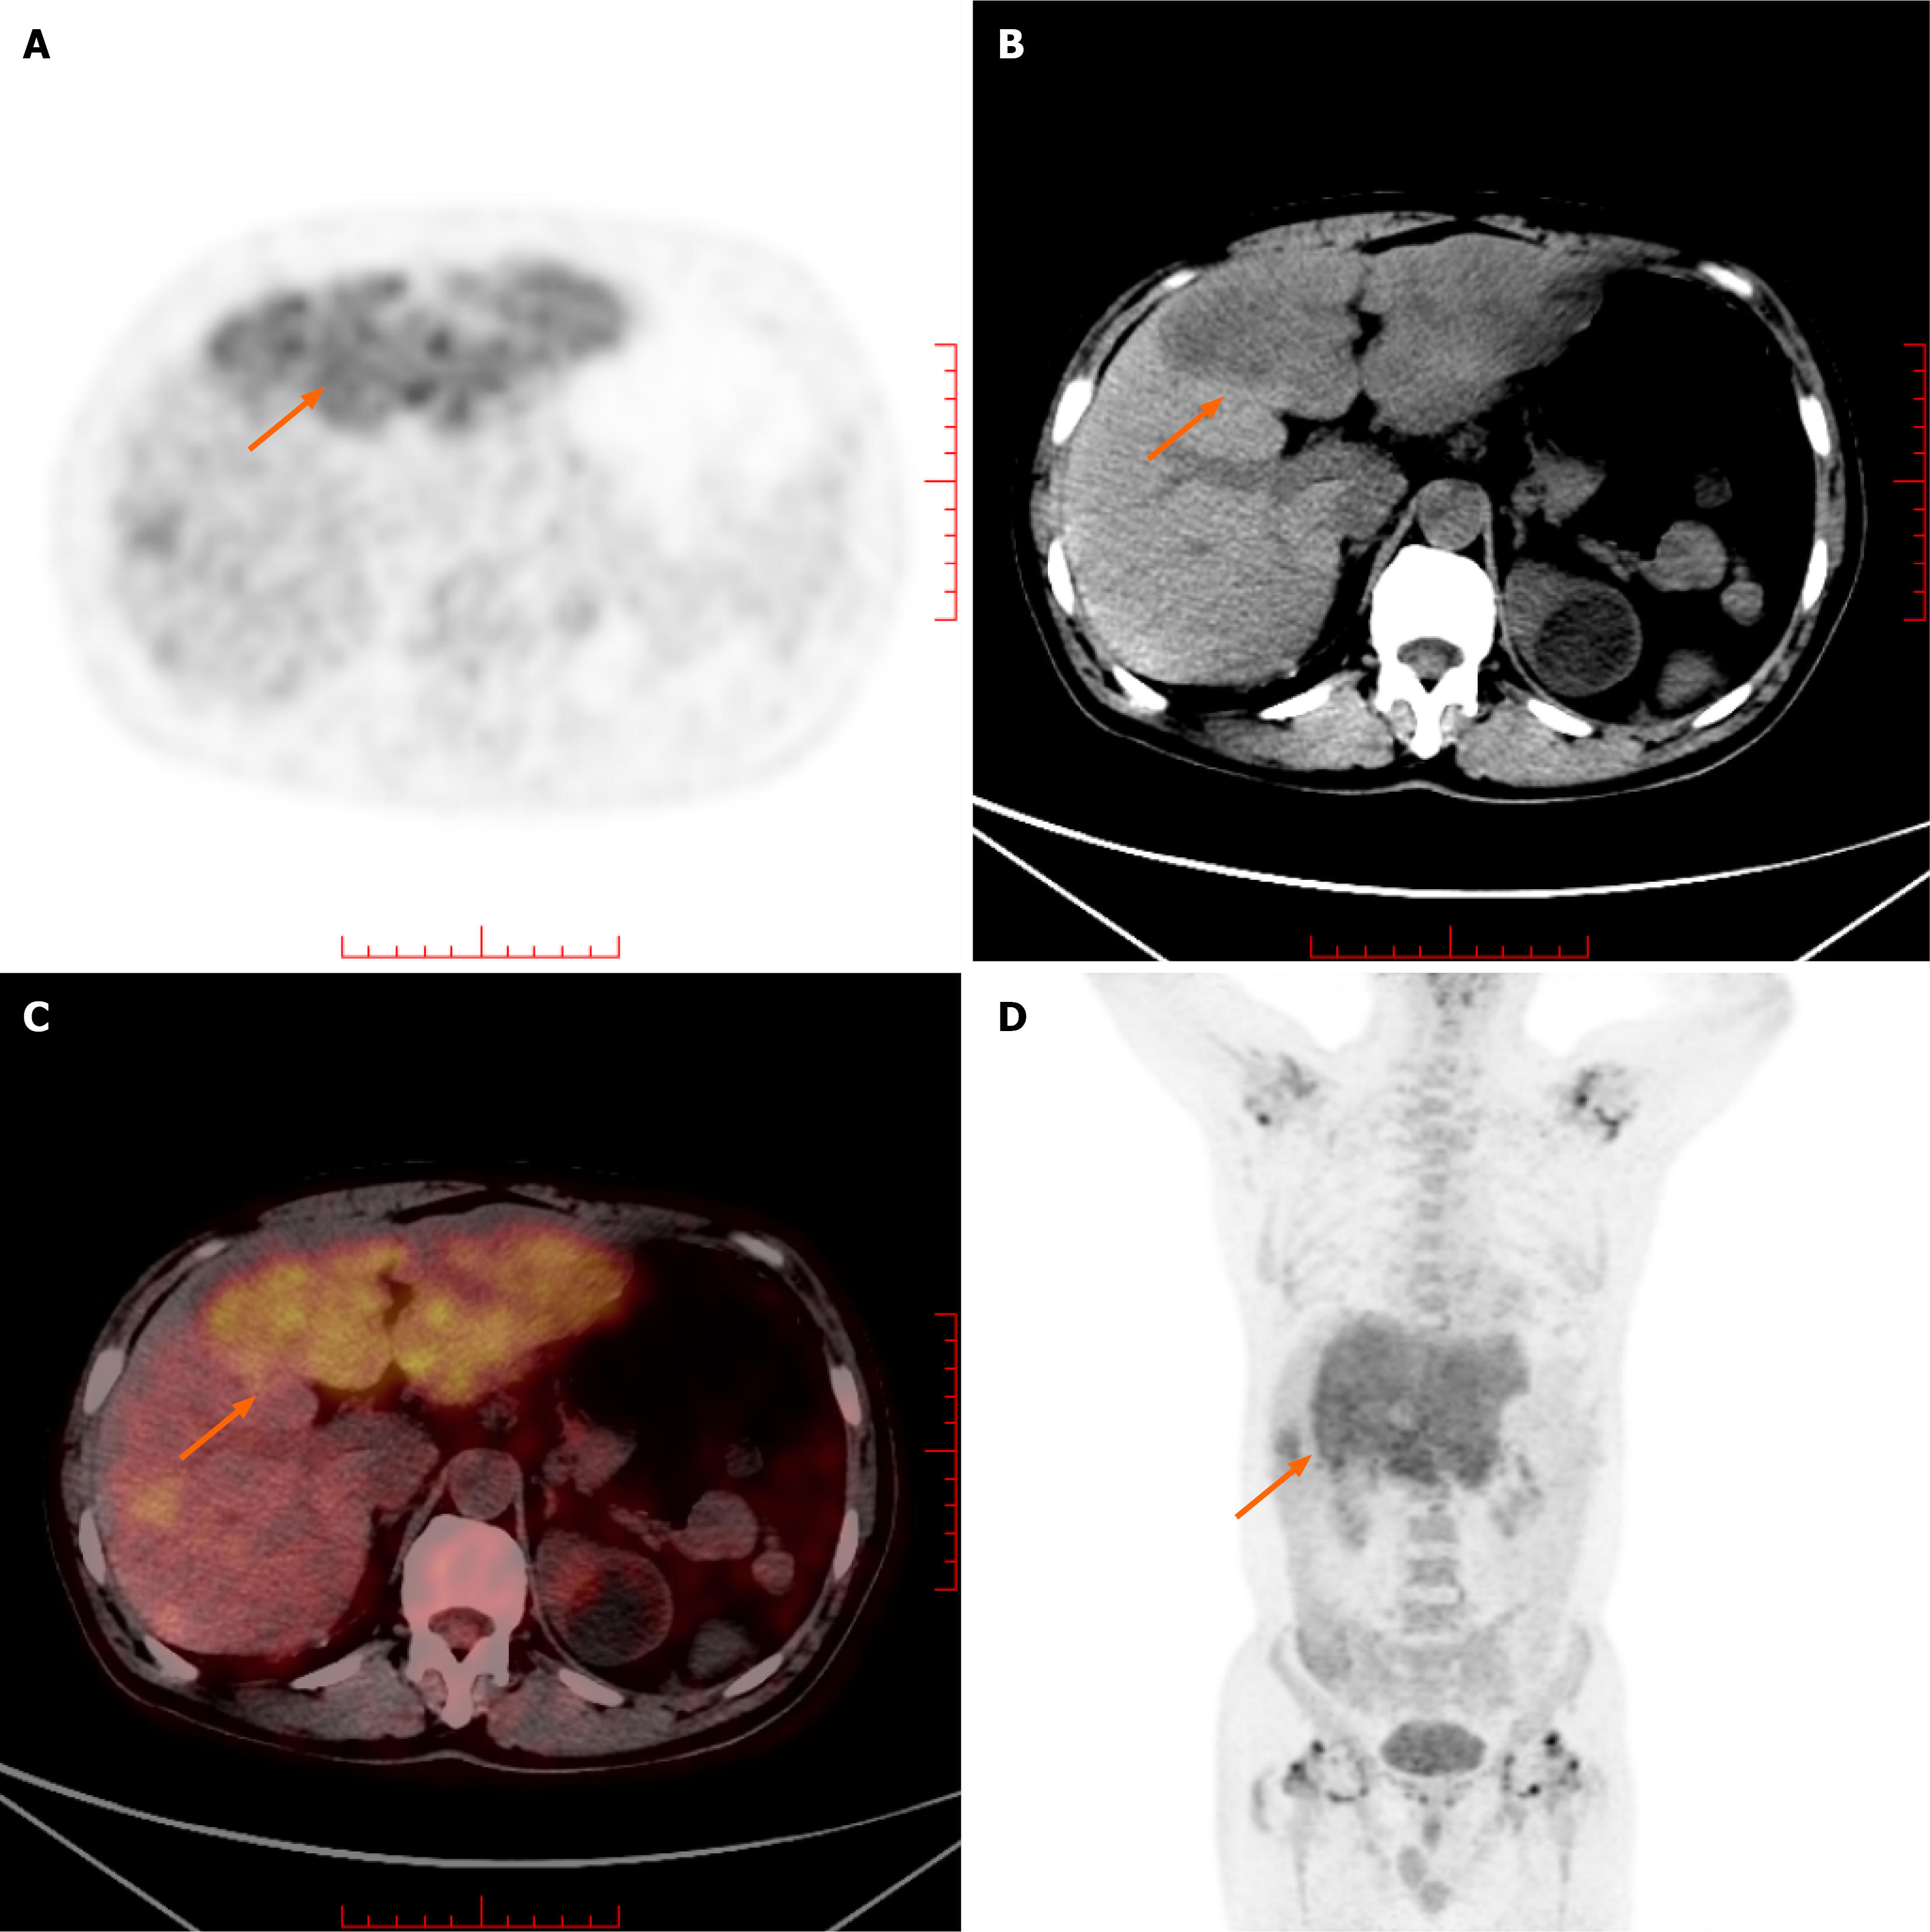
Figure 3 Whole-body 18F-fluorodeoxyglucose positron emission tomography/computed tomography images.
A: Axial positron emission tomography image shows increased 18F-fluorodeoxyglucose (18F-FDG) uptake in the hepatic lesion; B: Axial computed tomography (CT) image shows the corresponding hepatic lesion; C: Fused 18F-FDG positron emission tomography/CT image localizes the hypermetabolic activity to the liver; D: Maximum-intensity projection image shows increased metabolic activity confined to the hepatic region, with no definite evidence of an extrahepatic hypermetabolic malignancy.
- Citation: Qing D, Pan SL, Zhao J, Liu XB, Li WN. Primary squamous cell carcinoma arising in the liver: A case report and review of literature. World J Gastrointest Oncol 2026; 18(10): 124211
- URL: https://www.wjgnet.com/1948-5204/full/v18/i10/124211.htm
- DOI: https://dx.doi.org/10.4251/wjgo.124211