
















Copyright: ©Author(s) 2026.
World J Gastrointest Oncol. Oct 15, 2026; 18(10): 124211
Published online Oct 15, 2026. doi: 10.4251/wjgo.124211
Published online Oct 15, 2026. doi: 10.4251/wjgo.124211
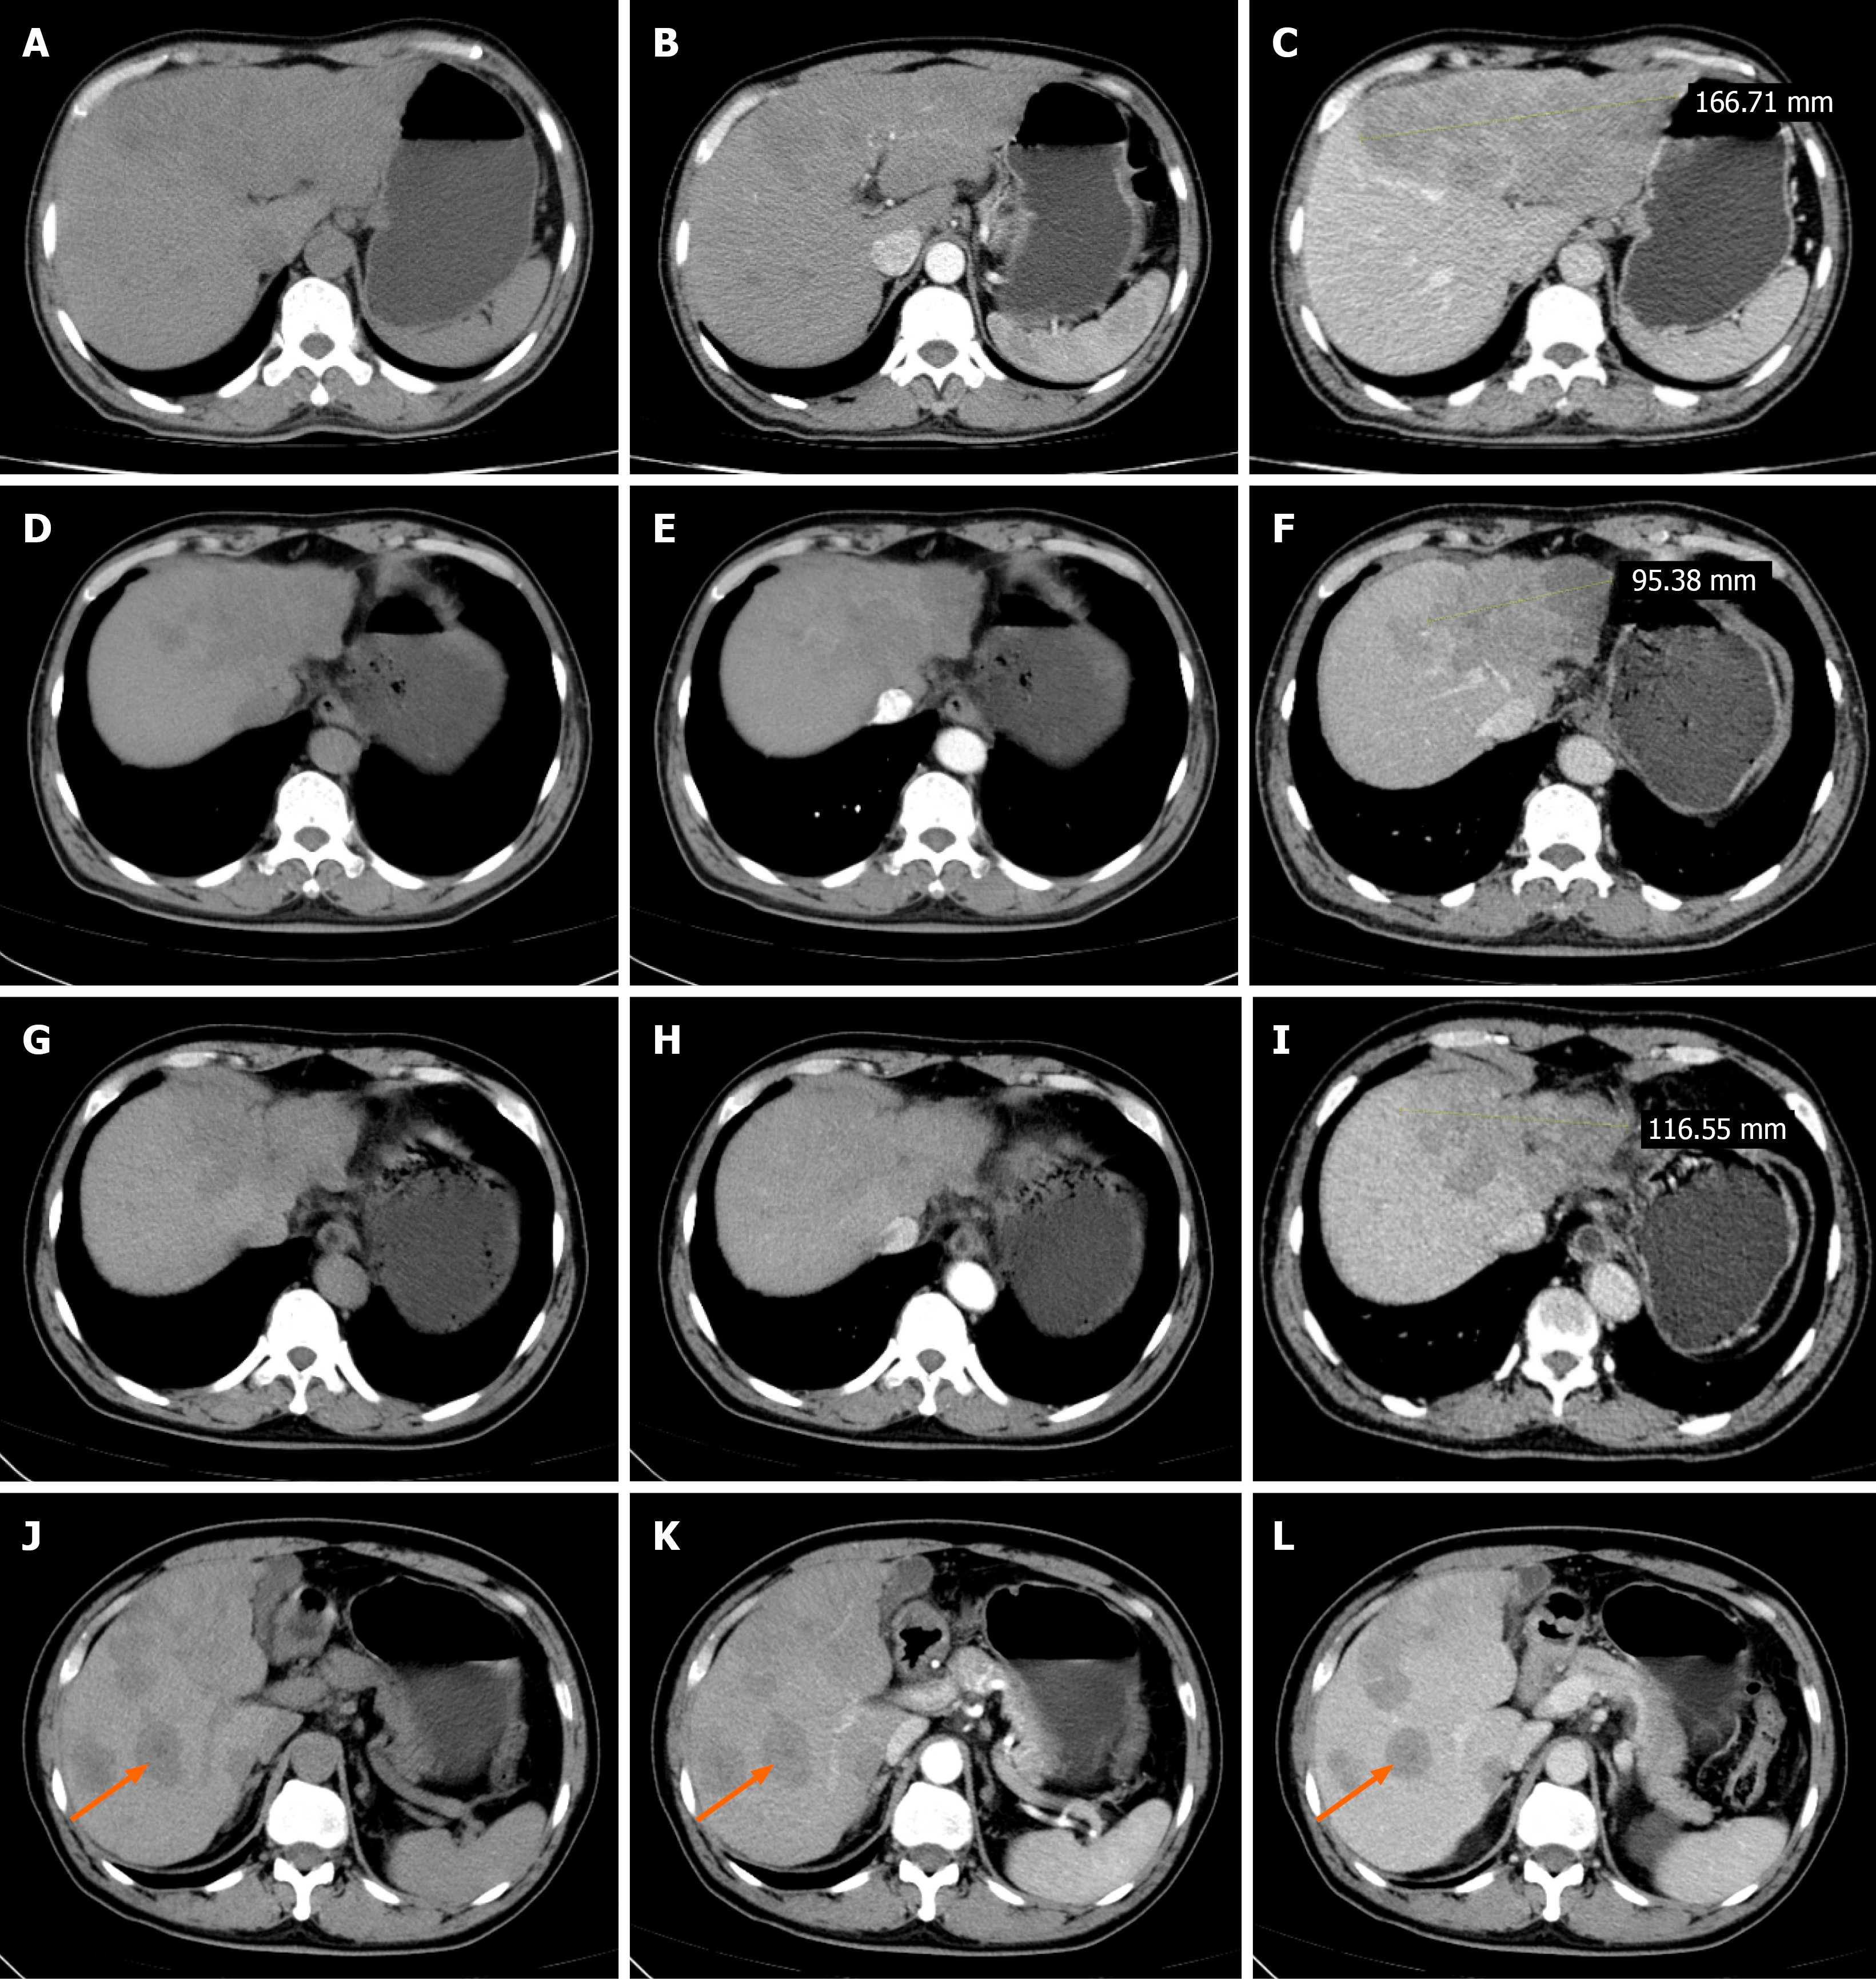
Figure 1 Serial contrast-enhanced computed tomography findings during treatment and follow-up.
A-C: Baseline liver computed tomography (CT) obtained on October 23, 2022, including the noncontrast phase (A), the arterial phase (B), and the portal venous phase (C), showing a large heterogeneous lesion predominantly involving the left hepatic lobe; D-F: Follow-up CT obtained on July 24, 2023, including the noncontrast phase (D), the arterial phase (E), and the portal venous phase (F), showing a marked reduction in the size of the target lesion; G-I: Follow-up CT obtained on March 10, 2024, including the noncontrast phase (G), the arterial phase (H), and the portal venous phase (I), showing enlargement of the target lesion. The measurement lines in panels C, F, and I indicate the longest diameter of the selected target lesion used for retrospective Response Evaluation Criteria in Solid Tumors version 1.1 assessment; J-L: Additional CT images obtained at a different axial level on March 10, 2024, including the noncontrast phase (J), the arterial phase (K), and the portal venous phase (L), demonstrating newly developed intrahepatic lesions. Orange arrows indicate representative newly developed intrahepatic lesions.
- Citation: Qing D, Pan SL, Zhao J, Liu XB, Li WN. Primary squamous cell carcinoma arising in the liver: A case report and review of literature. World J Gastrointest Oncol 2026; 18(10): 124211
- URL: https://www.wjgnet.com/1948-5204/full/v18/i10/124211.htm
- DOI: https://dx.doi.org/10.4251/wjgo.124211