
















Copyright: ©Author(s) 2026.
World J Gastrointest Oncol. Oct 15, 2026; 18(10): 123703
Published online Oct 15, 2026. doi: 10.4251/wjgo.123703
Published online Oct 15, 2026. doi: 10.4251/wjgo.123703
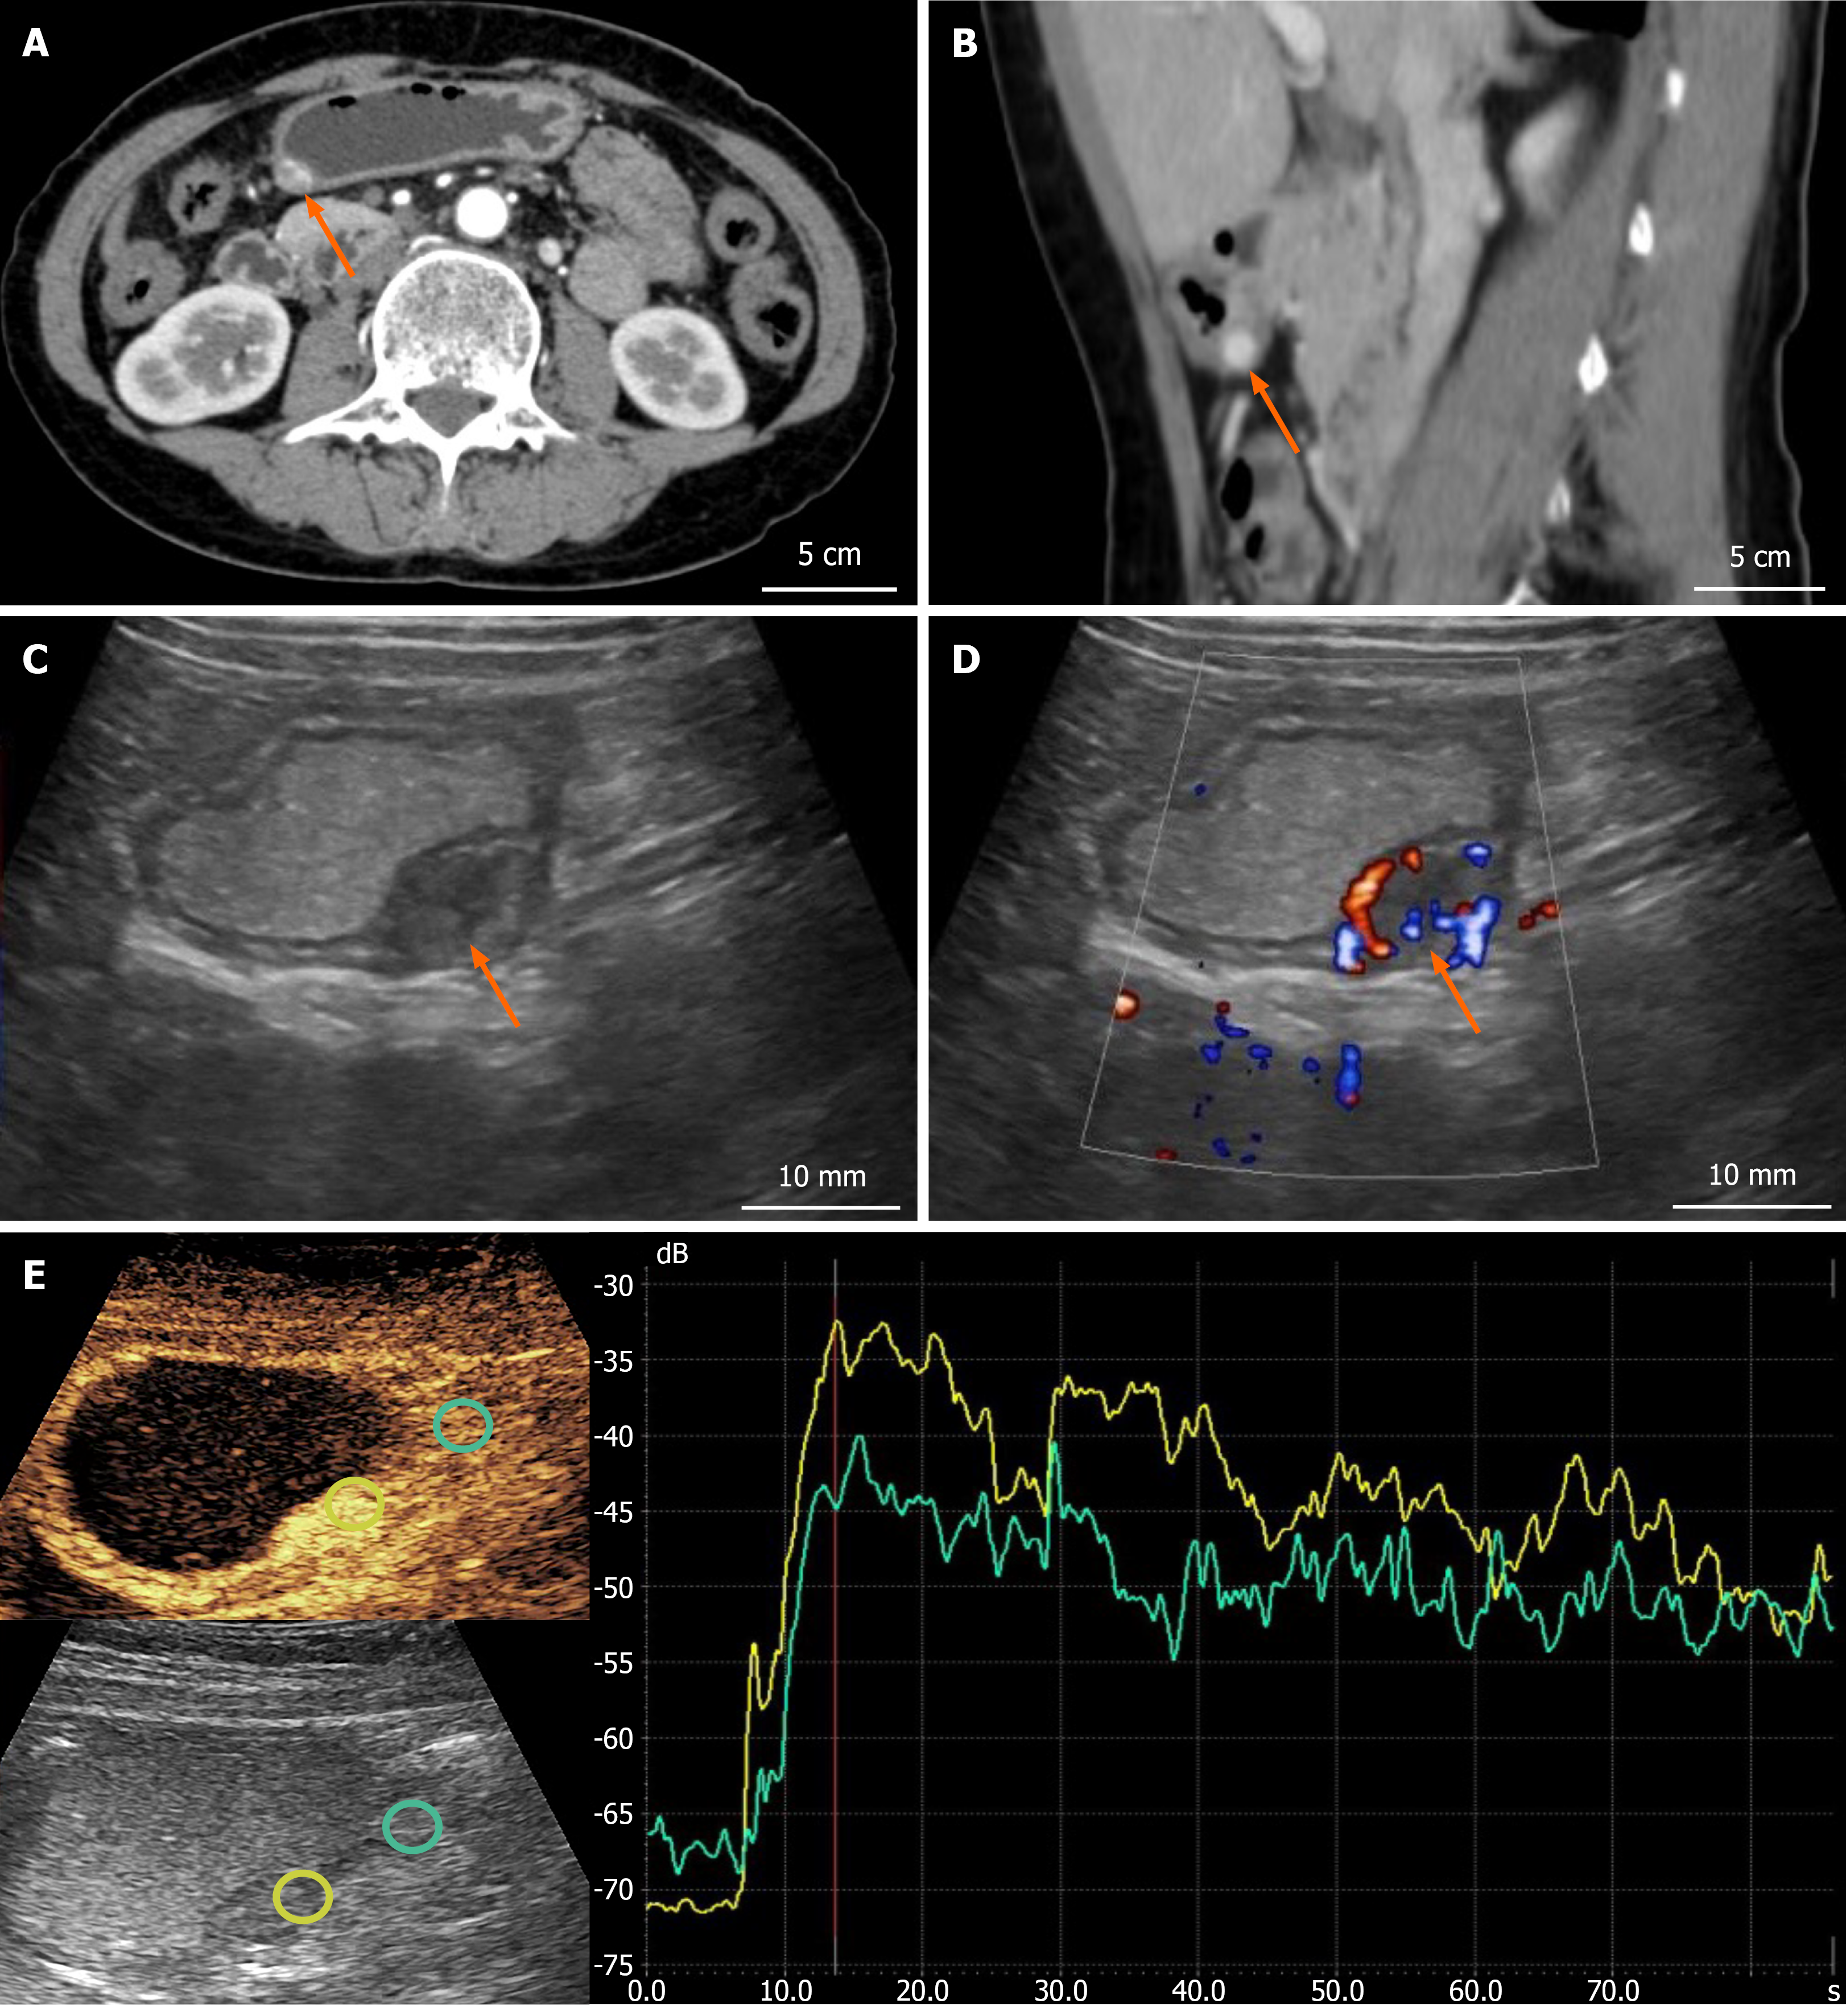
Figure 1 Imaging findings of the gastric glomus tumor.
A and B: Contrast-enhanced computed tomography showed a well-defined enhancing nodule in the gastric antrum on axial and sagittal images (arrows; scale bar: 5 cm); C: Double contrast-enhanced ultrasonography demonstrated a hypoechoic ovoid lesion on the greater curvature of the gastric antrum, slightly protruding outward; D: Color Doppler ultrasonography revealed abundant intralesional blood flow signals (arrow; scale bar: 5 mm); E: Contrast-enhanced ultrasonography and the corresponding time–intensity curve demonstrated earlier and stronger enhancement of the lesion than the adjacent gastric wall, followed by slight washout while remaining hyperenhanced in the delayed phase.
- Citation: Luo YK, Yu HY, Bao YP, Mao JQ, Chen YB. Double contrast-enhanced ultrasonography in an exophytic gastric glomus tumor with unremarkable gastroscopy: A case report. World J Gastrointest Oncol 2026; 18(10): 123703
- URL: https://www.wjgnet.com/1948-5204/full/v18/i10/123703.htm
- DOI: https://dx.doi.org/10.4251/wjgo.123703