
















Copyright: ©Author(s) 2026.
World J Gastrointest Oncol. Oct 15, 2026; 18(10): 122796
Published online Oct 15, 2026. doi: 10.4251/wjgo.122796
Published online Oct 15, 2026. doi: 10.4251/wjgo.122796
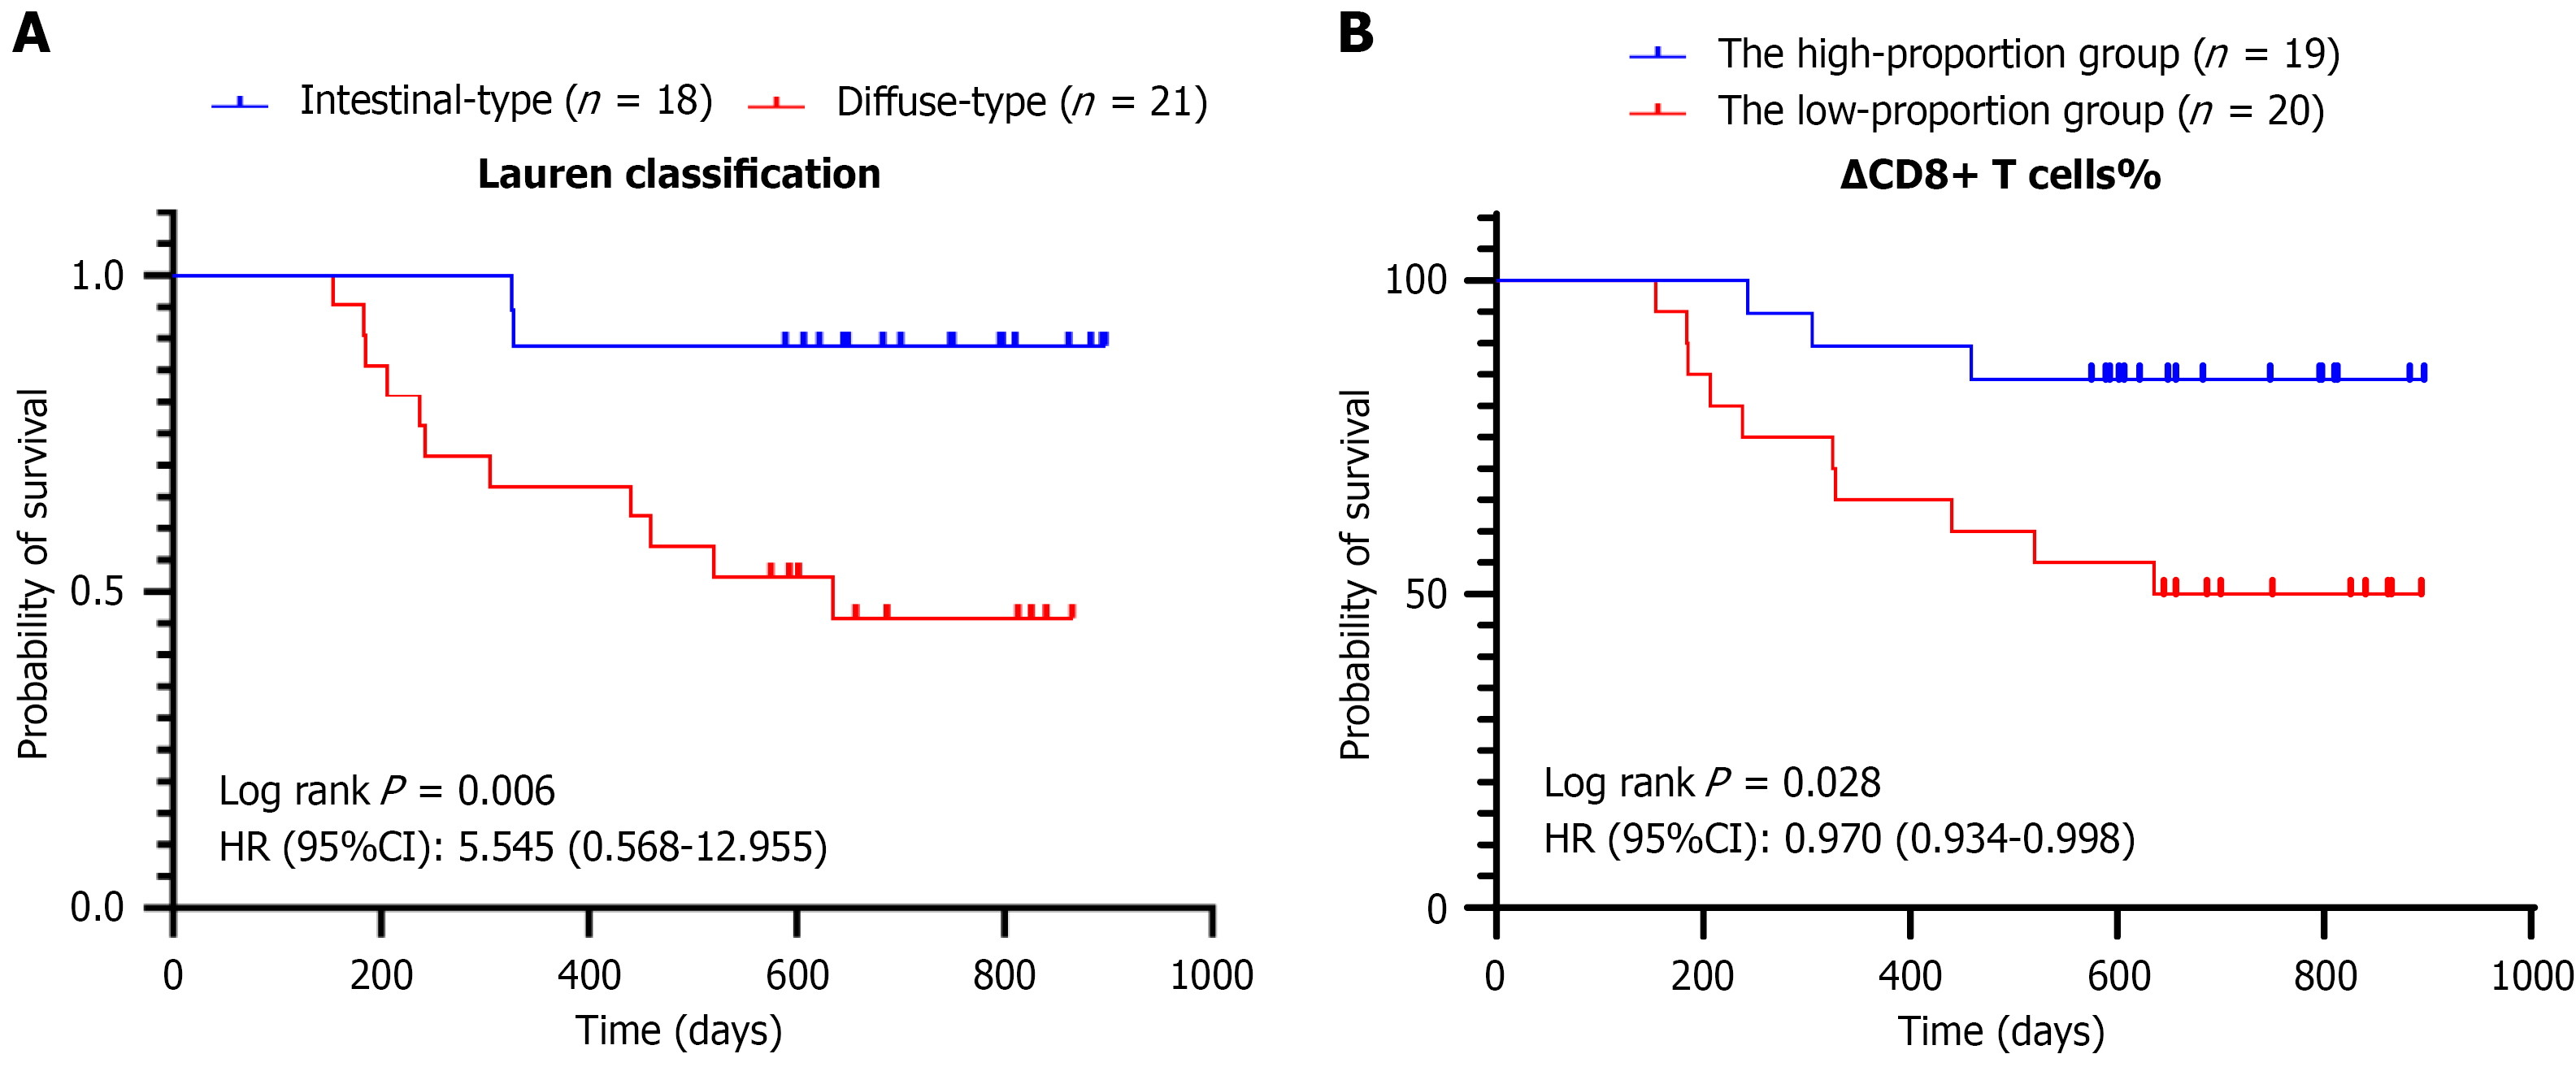
Figure 2 Kaplan-Meier curves.
A: Kaplan-Meier curves for progression-free survival stratified by Lauren classification; B: Kaplan-Meier curves for progression-free survival plotted by stratification on the basis of the relative change in the proportion of CD8+ T cells. HR: Hazard ratio; CI: Confidence interval.
- Citation: Wu Y, Xu MM, Wang GL, Du WD, Su XH. Peripheral blood marker changes predict response and prognosis in locally advanced gastric cancer with neoadjuvant sintilimab plus XELOX. World J Gastrointest Oncol 2026; 18(10): 122796
- URL: https://www.wjgnet.com/1948-5204/full/v18/i10/122796.htm
- DOI: https://dx.doi.org/10.4251/wjgo.122796