
















Copyright: ©Author(s) 2026.
World J Gastrointest Oncol. Oct 15, 2026; 18(10): 119879
Published online Oct 15, 2026. doi: 10.4251/wjgo.119879
Published online Oct 15, 2026. doi: 10.4251/wjgo.119879
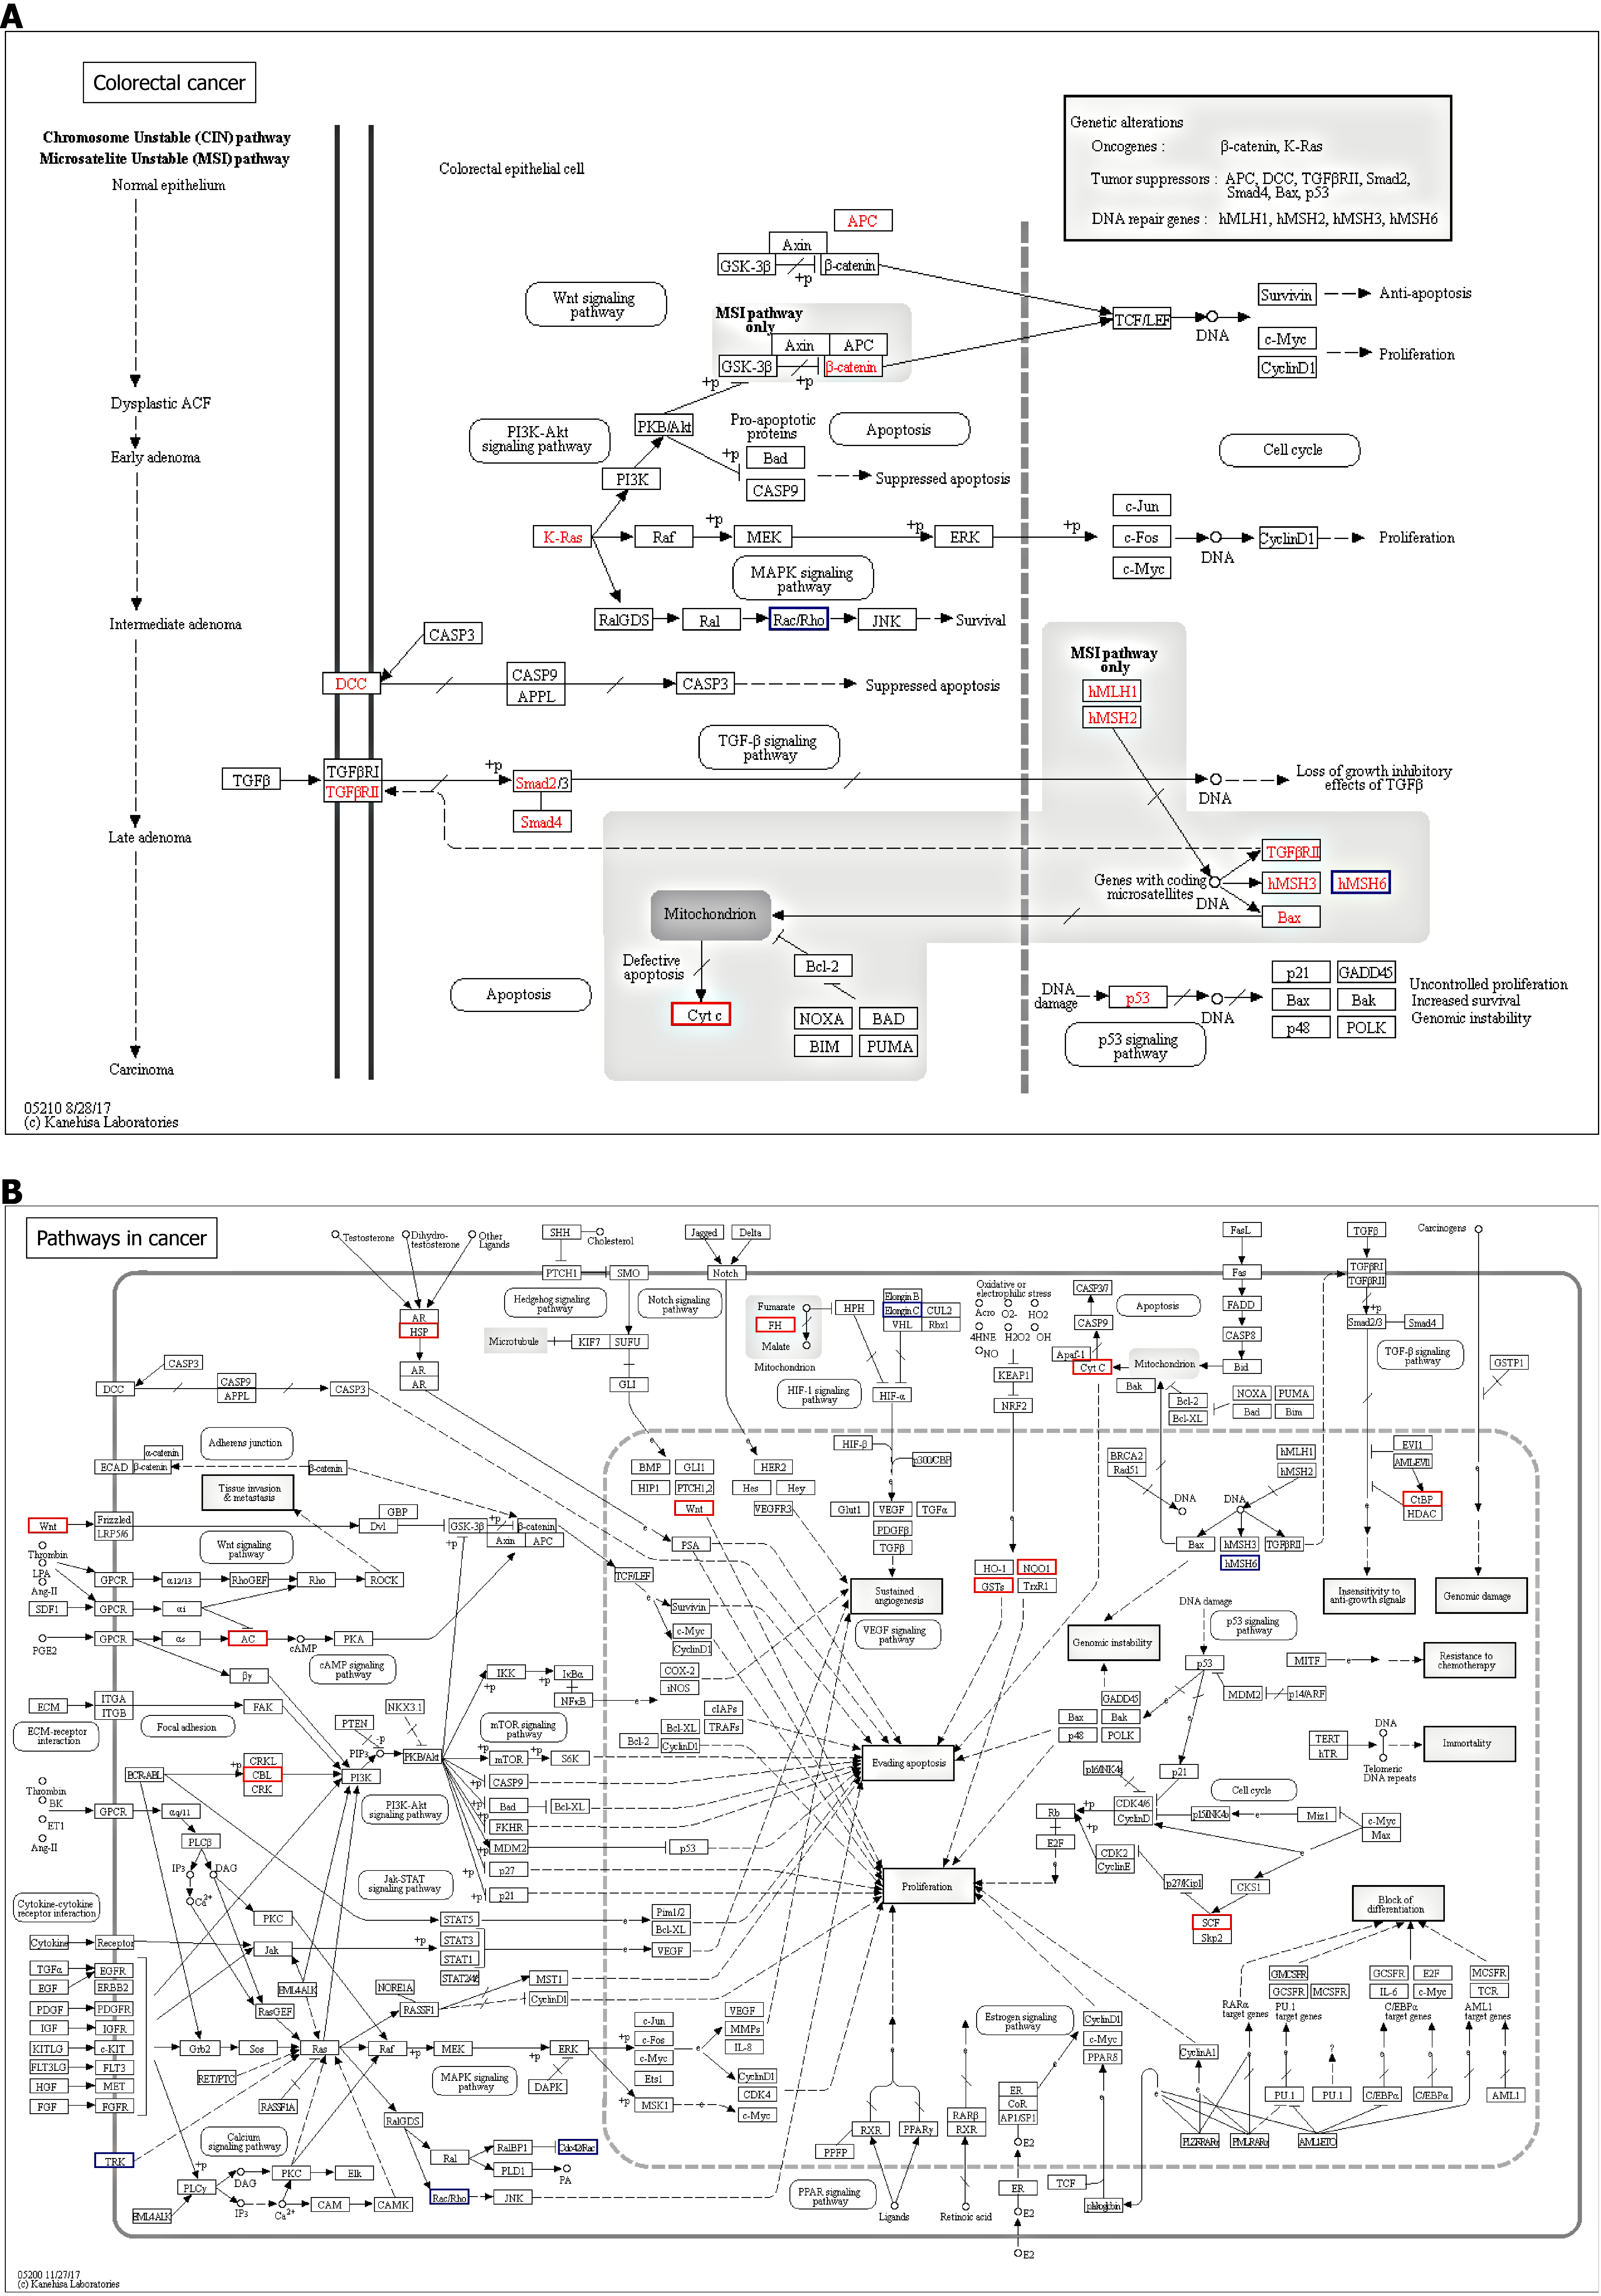
Figure 6 Comparison of cancer-related metabolic pathways between the diabetes mellitus and diabetes mellitus-colorectal cancer groups based on Kyoto Encyclopedia of Genes and Genomes database analysis.
Differences in metabolic pathway maps between the diabetes mellitus (DM) and DM-colorectal cancer groups were examined using the Kyoto Encyclopedia of Genes and Genomes database, and a metabolic pathway webpage map was generated. The figure highlights cancer-related metabolic pathways within the Kyoto Encyclopedia of Genes and Genomes pathway overview map, showing both shared and unique metabolic pathway information between the two groups. In the diagram, nodes represent chemical compounds, and edges represent enzyme-catalyzed reactions. Red indicates reactions common to both groups, while blue denotes reactions unique to the DM-colorectal cancer group. A: Pathways of colorectal cancer; B: Pathways in cancer.
- Citation: Lai Y, Xu JH, Chen YJ, Luo H, Lin Y, Yu YF, Chen QK. Enterocloster bolteae drives hyperglycemia-associated colorectal cancer cell proliferation via Rac/Rho-MSH6-Elongin C signaling pathway. World J Gastrointest Oncol 2026; 18(10): 119879
- URL: https://www.wjgnet.com/1948-5204/full/v18/i10/119879.htm
- DOI: https://dx.doi.org/10.4251/wjgo.119879