
















Copyright: ©Author(s) 2026.
World J Gastrointest Oncol. Oct 15, 2026; 18(10): 119879
Published online Oct 15, 2026. doi: 10.4251/wjgo.119879
Published online Oct 15, 2026. doi: 10.4251/wjgo.119879
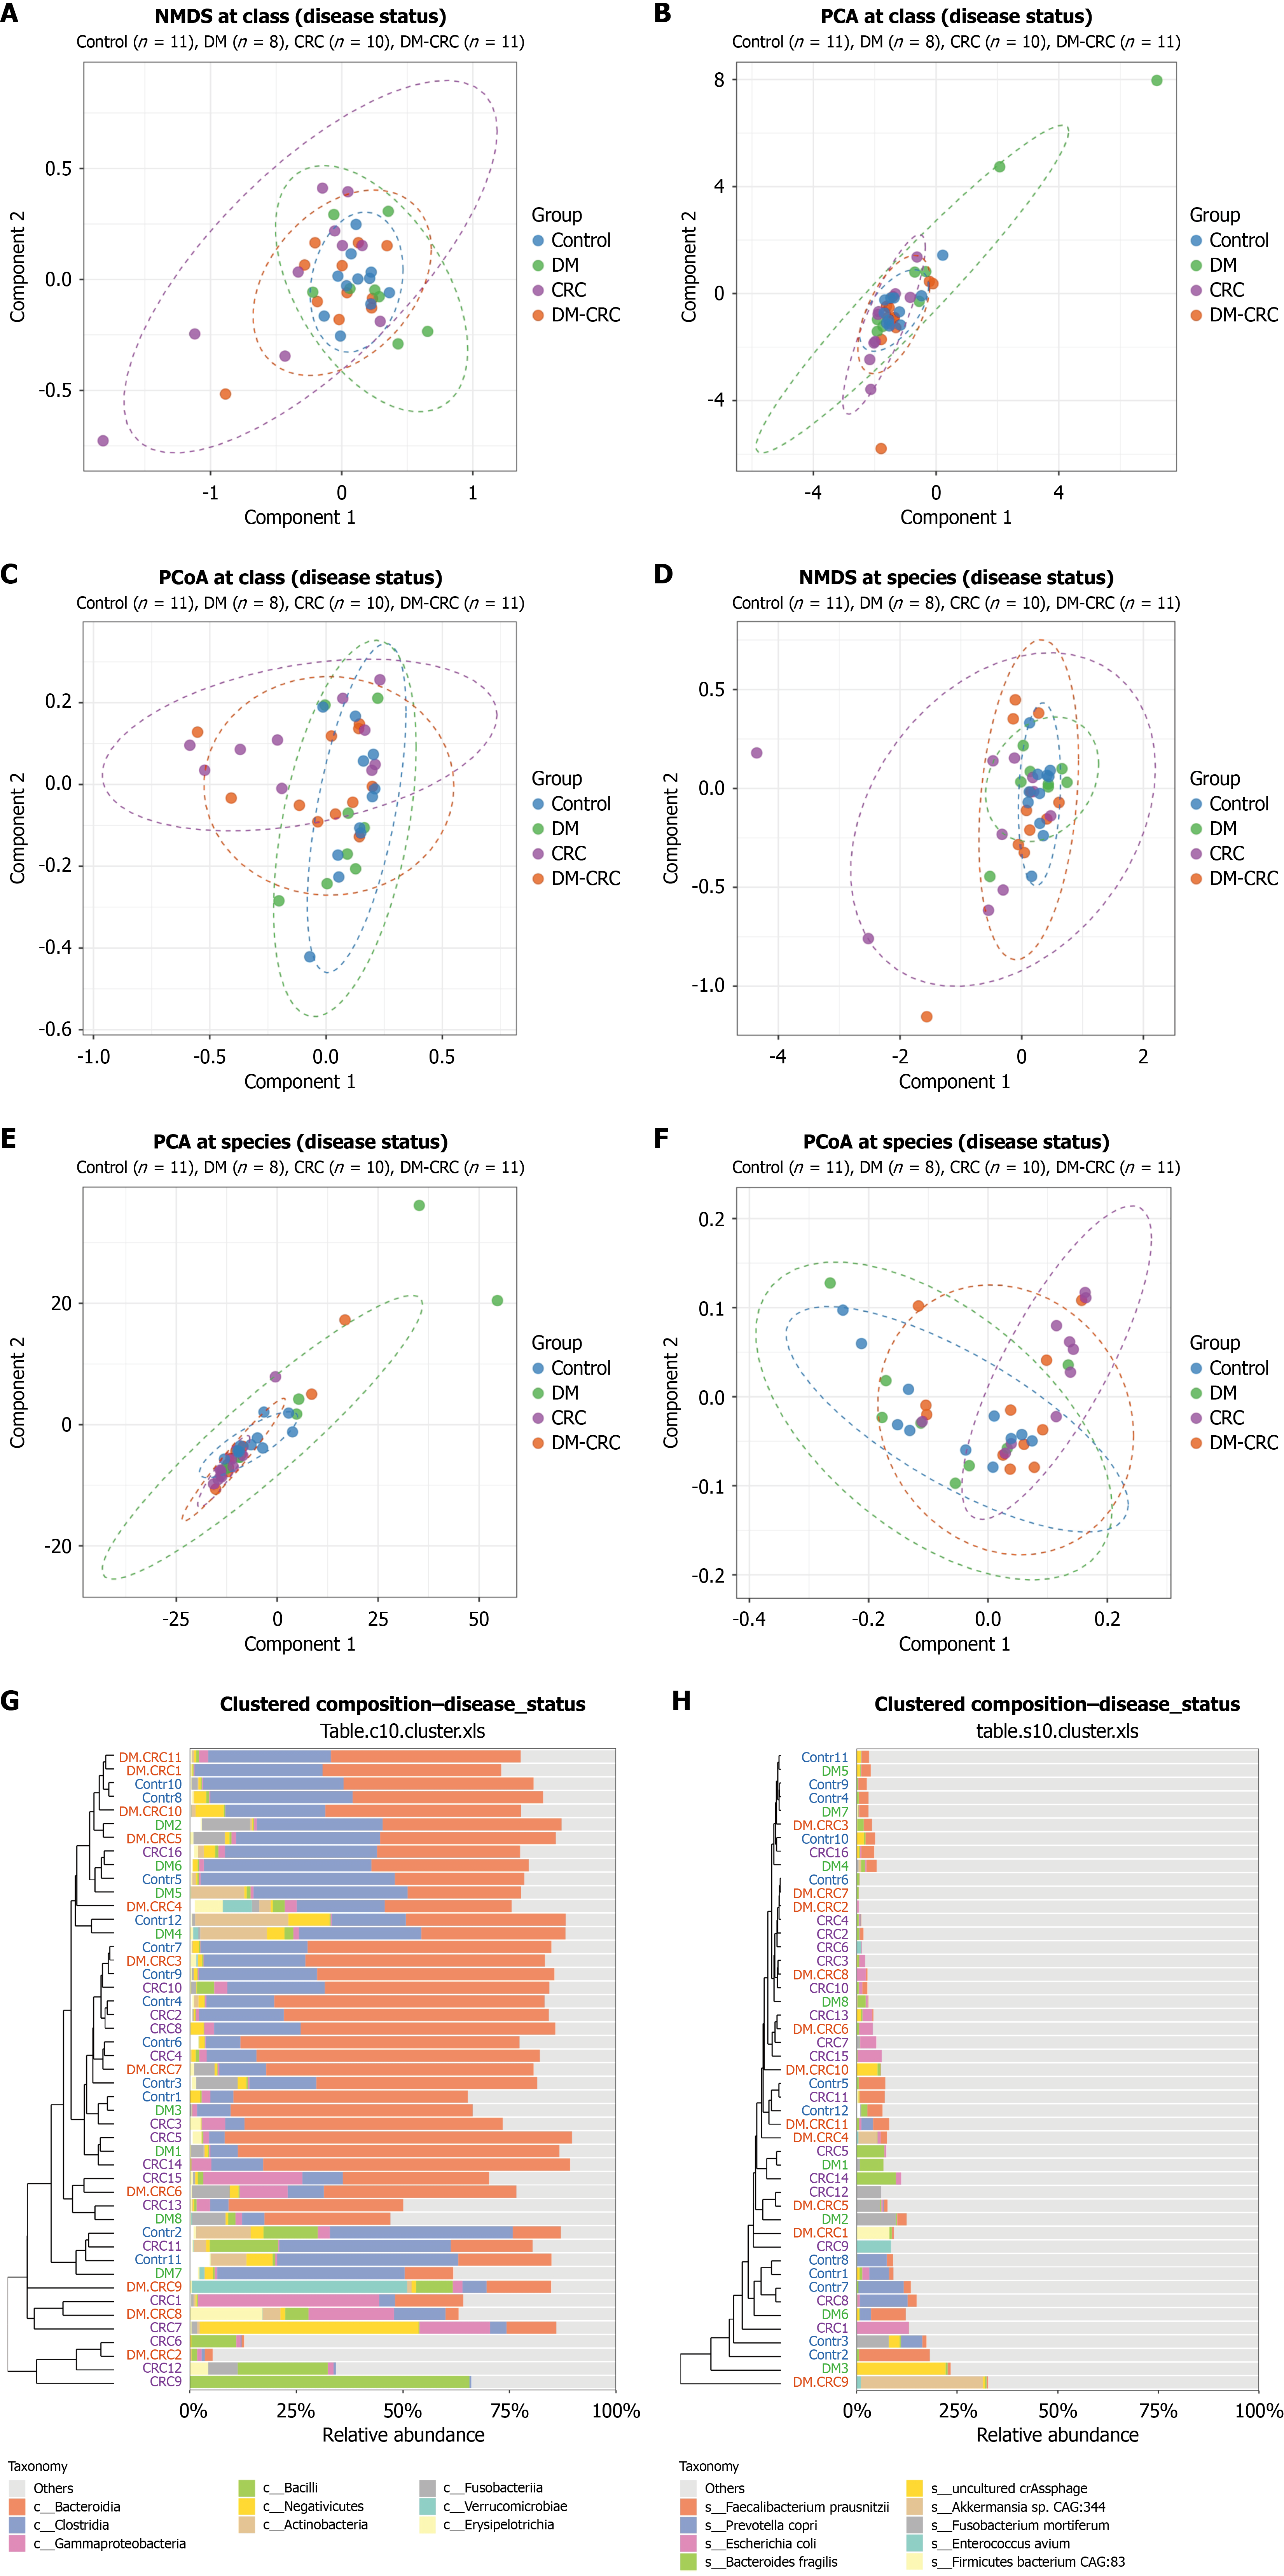
Figure 2 Dimensionality reduction analysis based on species abundance.
Each point in the figure represents a sample, and the distance between points represents the degree of difference. Samples from the same group are color-coded accordingly. The results show significant differences among the groups. A: Non-metric multidimensional scaling (NMDS) plot at the class level. A stress value less than 0.2 indicates that the NMDS analysis has reasonable reliability; B: Principal component analysis plot at the class level. The horizontal axis represents the first principal component, and the vertical axis represents the second principal component; percentages indicate the contribution of each component to sample variance; C: Principal coordinate analysis plot based on Bray-Curtis distance at the class level; D: NMDS plot at the species level. A stress value less than 0.2 indicates that the NMDS analysis has reasonable reliability; E: Principal component analysis plot at the species level. The horizontal axis represents the first principal component, and the vertical axis represents the second principal component; percentages indicate the contribution of each component to sample variance; F: Principal coordinate analysis plot based on Bray-Curtis distance at the species level; G: Bray-Curtis distance clustering tree (left) and relative abundance distribution of functions at the class level for each sample (right); H: Relative abundance distribution at the species level for each sample. DM: Diabetes mellitus; CRC: Colorectal cancer; NMDS: Non-metric multidimensional scaling; PCA: Principal component analysis; PCoA: Principal coordinate analysis.
- Citation: Lai Y, Xu JH, Chen YJ, Luo H, Lin Y, Yu YF, Chen QK. Enterocloster bolteae drives hyperglycemia-associated colorectal cancer cell proliferation via Rac/Rho-MSH6-Elongin C signaling pathway. World J Gastrointest Oncol 2026; 18(10): 119879
- URL: https://www.wjgnet.com/1948-5204/full/v18/i10/119879.htm
- DOI: https://dx.doi.org/10.4251/wjgo.119879