
















Copyright: ©Author(s) 2026.
World J Gastrointest Oncol. Oct 15, 2026; 18(10): 119879
Published online Oct 15, 2026. doi: 10.4251/wjgo.119879
Published online Oct 15, 2026. doi: 10.4251/wjgo.119879
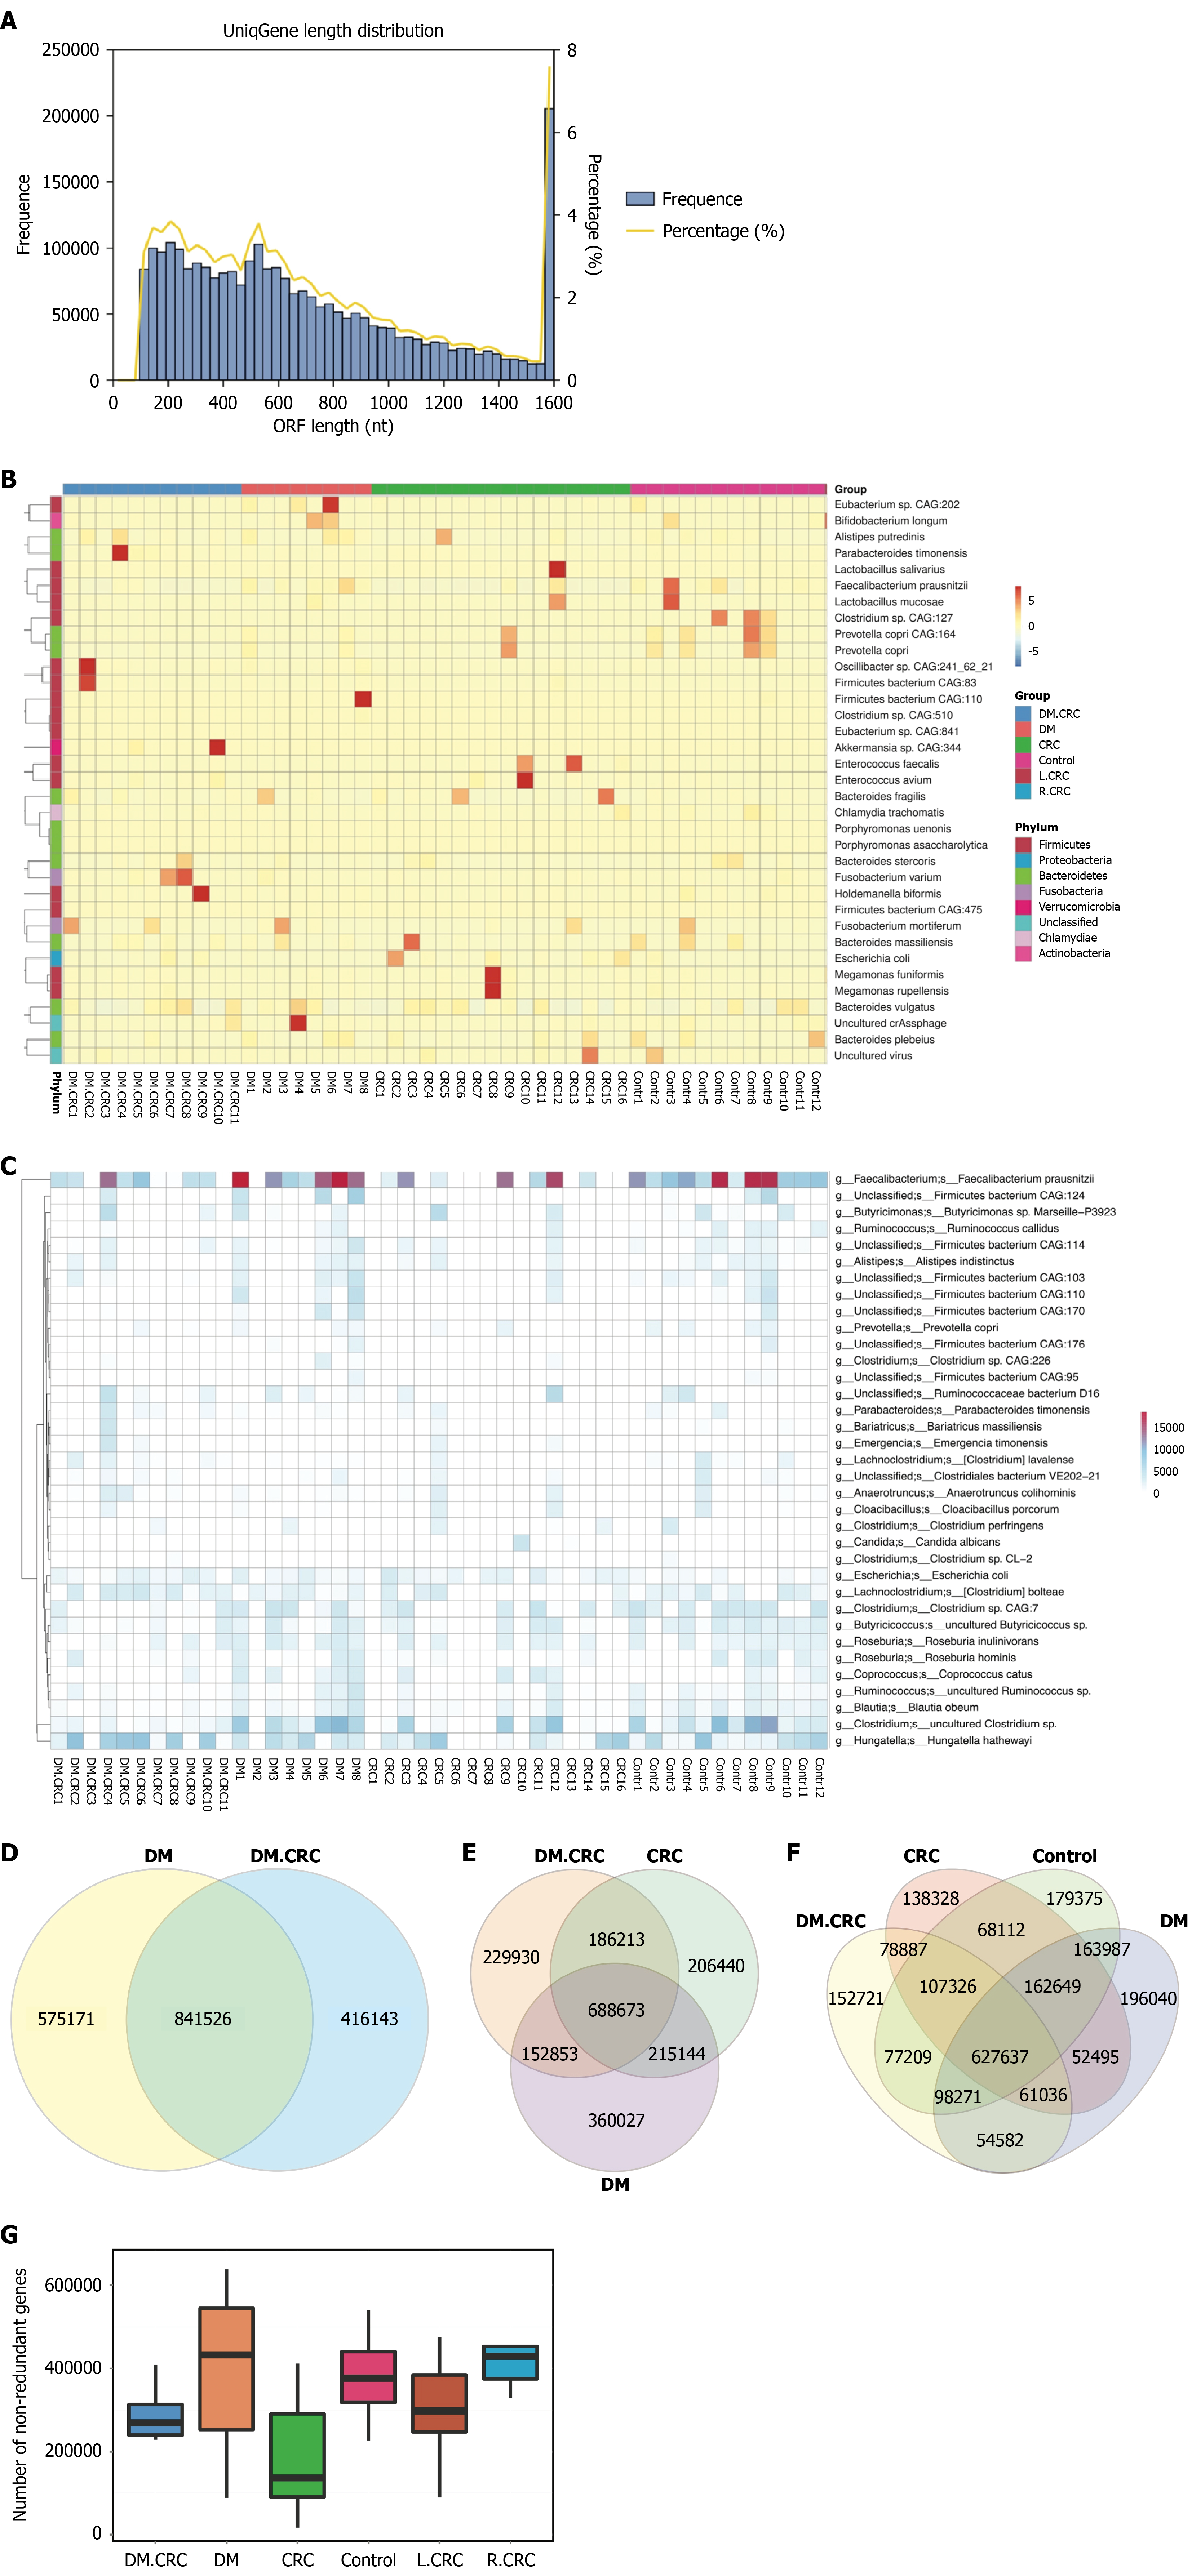
Figure 1 Common and unique information of genes among different samples (groups).
A: Degree distribution analysis of the gene catalog. The left vertical axis (frequency) represents the number of genes in the gene catalog; the right vertical axis (percentage, %) represents the percentage of genes in the gene catalog; the horizontal axis represents the degree of genes in the gene catalog; B: Heatmap of unigene annotation counts. The horizontal axis represents sample names; the vertical axis represents species information; different colors represent different numbers of unigenes; C: Horizontal relative abundance clustering heatmap. The horizontal axis represents sample information; the vertical axis represents species information. The clustering tree on the left is a species clustering tree. The values in the central heatmap correspond to Z-scores obtained by standardizing the relative abundance of each species per row. In this Z-score normalized heatmap, positive values (typically warmer colors such as red) indicate that the abundance/expression level of a given gene/species in a particular sample is higher than its mean level across all samples; higher magnitudes (e.g., +2 and +3) reflect greater deviation above the average. Negative values (typically cooler colors such as blue) indicate that abundance/expression levels below the overall mean; smaller values (e.g., -2 and -3) eflect greater deviation below the average. Values close to zero (often white) indicate that abundance/expression levels near the mean across all samples; D-F: Venn diagrams showing shared and unique genes across individual samples. Each circle represents one sample, with colors indicating group affiliation: Patients with diabetes mellitus (n = 8), patients with diabetes mellitus and colorectal cancer (n = 11), patients with colorectal cancer without diabetes (colorectal cancer, n = 10), and healthy controls (control, n = 11). Numbers in the overlapping regions denote the genes shared among samples, whereas numbers in the non-overlapping regions represent the unique genes identified in each sample; G: Box plot comparing gene counts between groups. The horizontal axis represents each group; the vertical axis represents the number of genes. Statistical differences in the number of genes among the four groups were evaluated using the Kruskal-Wallis H test. DM: Diabetes mellitus; CRC: Colorectal cancer; L.CRC: Left-sided colorectal cancer; R.CRC: Right-sided colorectal cancer.
- Citation: Lai Y, Xu JH, Chen YJ, Luo H, Lin Y, Yu YF, Chen QK. Enterocloster bolteae drives hyperglycemia-associated colorectal cancer cell proliferation via Rac/Rho-MSH6-Elongin C signaling pathway. World J Gastrointest Oncol 2026; 18(10): 119879
- URL: https://www.wjgnet.com/1948-5204/full/v18/i10/119879.htm
- DOI: https://dx.doi.org/10.4251/wjgo.119879