
















©The Author(s) 2026.
World J Gastrointest Oncol. Jan 15, 2026; 18(1): 113816
Published online Jan 15, 2026. doi: 10.4251/wjgo.v18.i1.113816
Published online Jan 15, 2026. doi: 10.4251/wjgo.v18.i1.113816
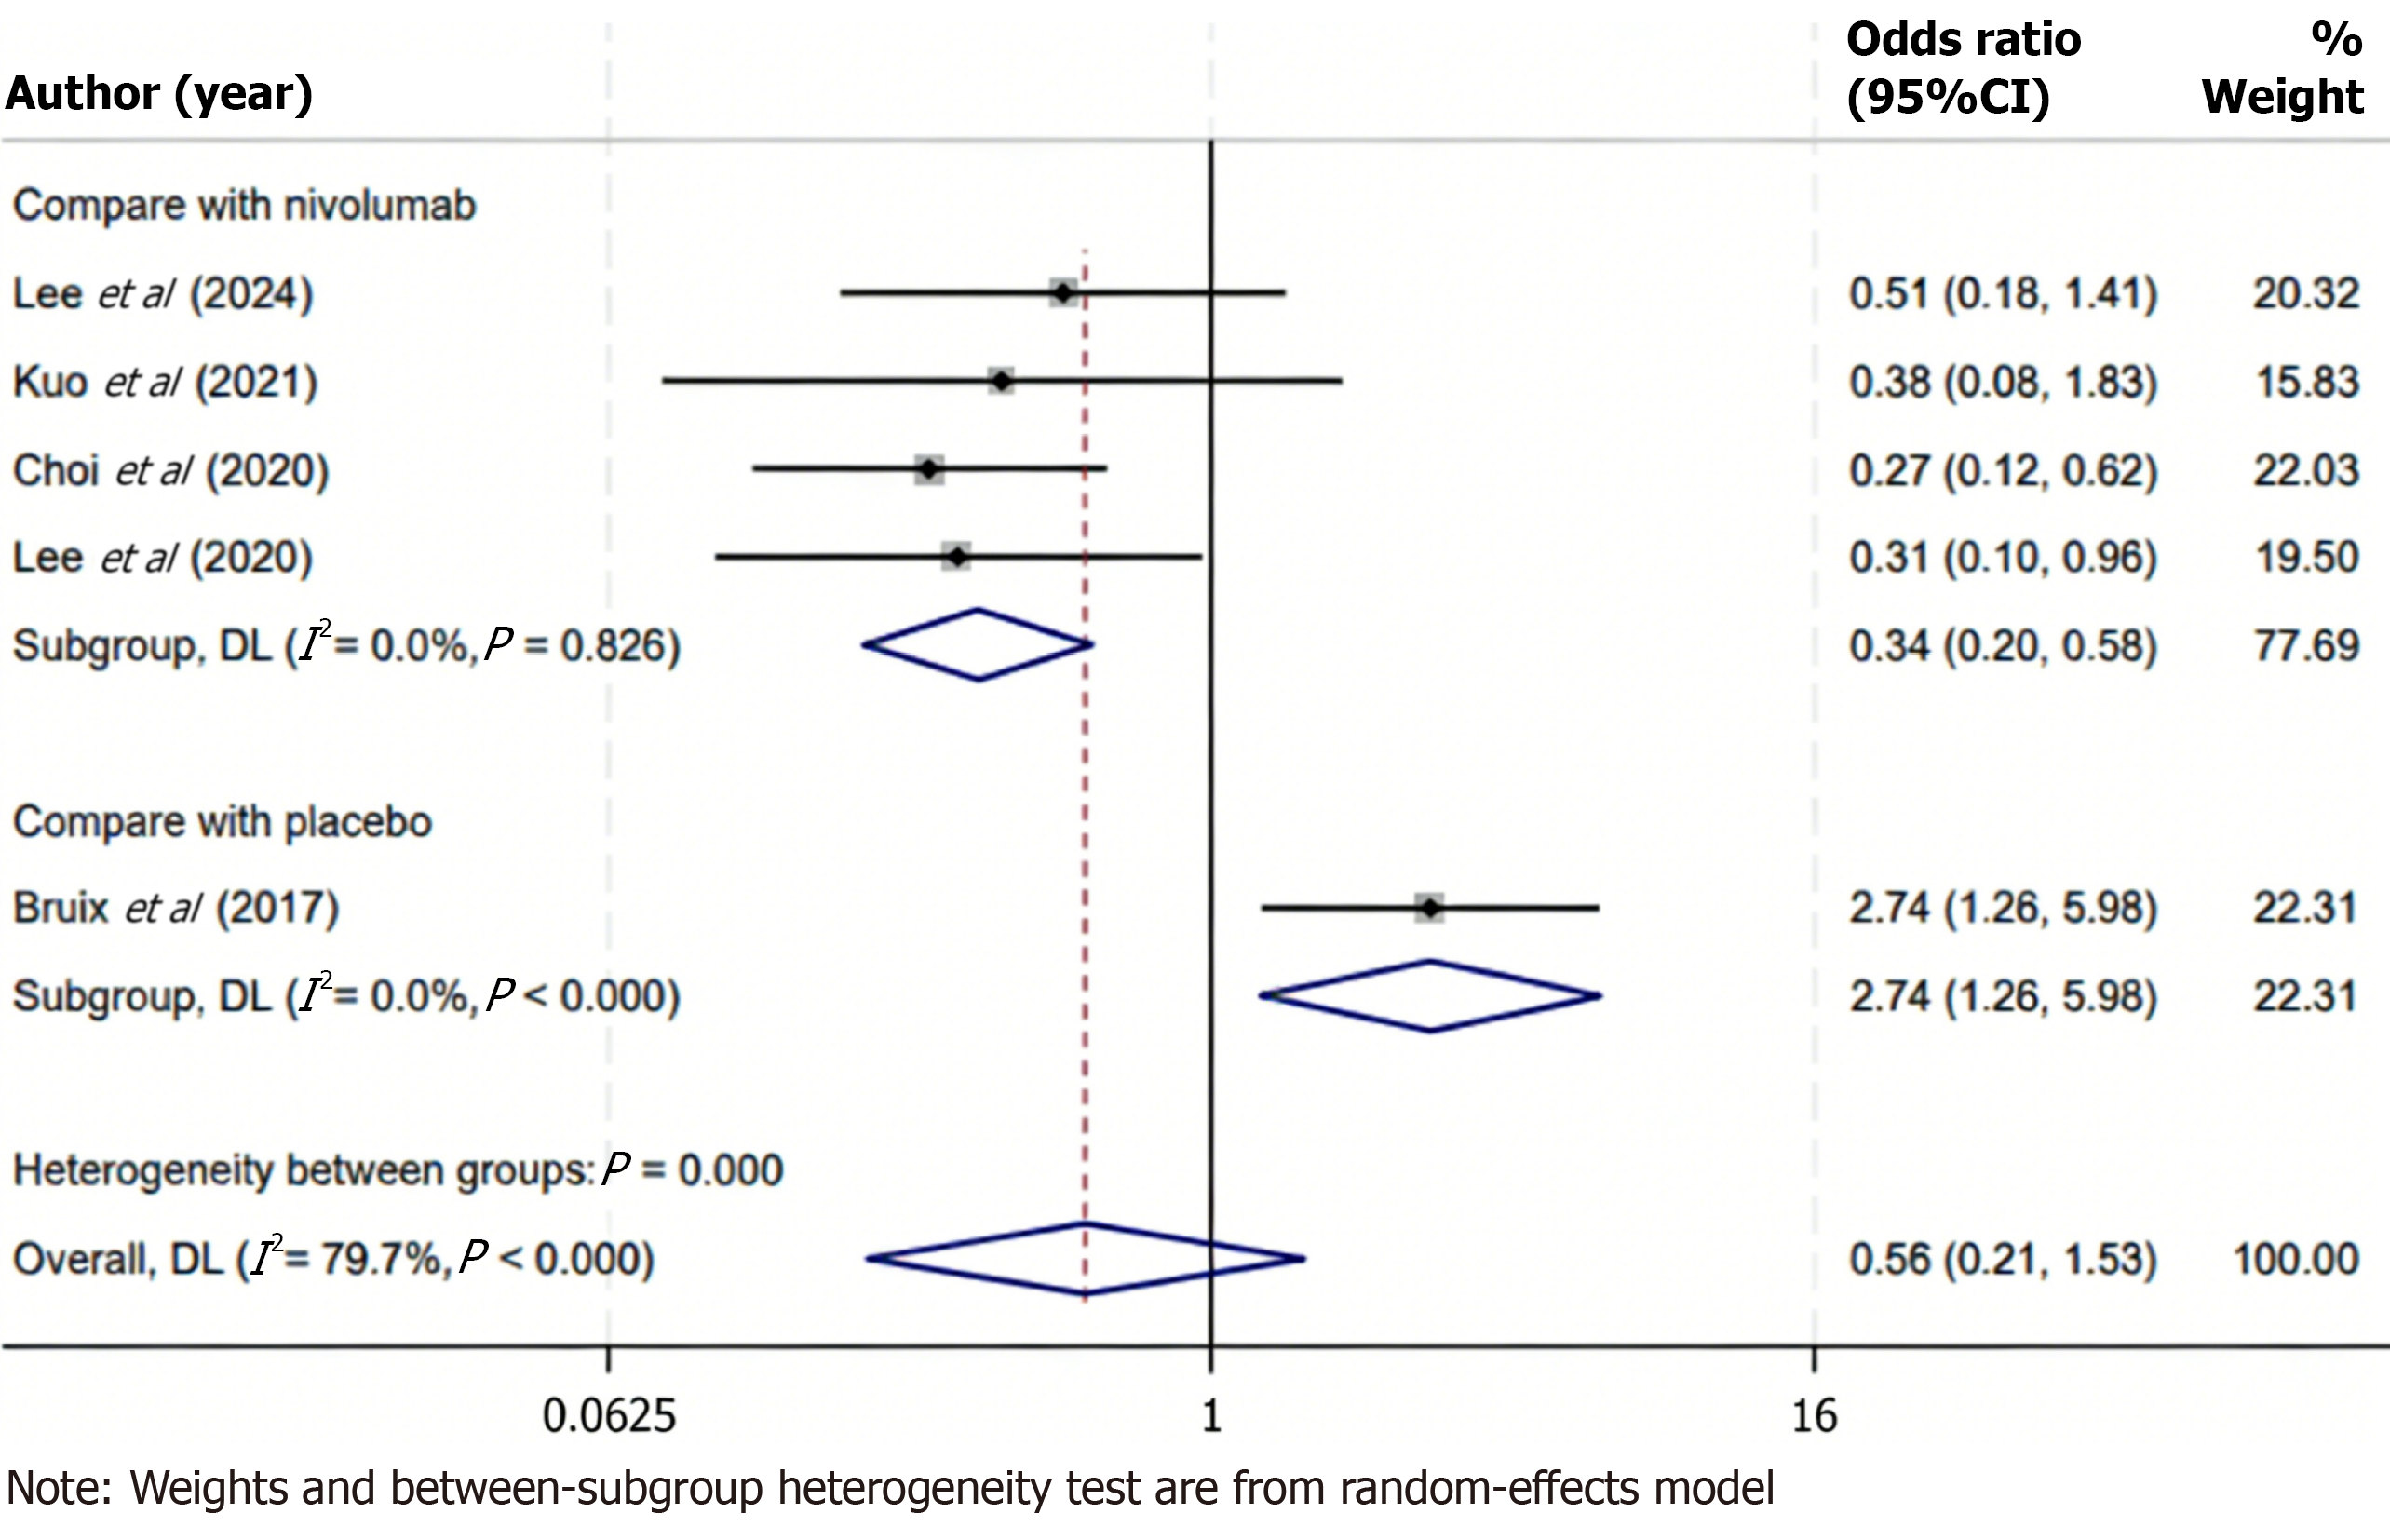
Figure 5 Forest plot of objective response rate for regorafenib vs control treatments, including subgroup analysis with nivolumab.
The overall analysis showed no significant difference in objective response rate (odds ratio = 0.56; 95% confidence interval: 0.21-1.53; P > 0.05; I2 = 79.7%). However, subgroup analysis demonstrated a significantly lower objective response rate with regorafenib compared to nivolumab (odds ratio = 0.34; 95% confidence interval: 0.20-0.58; P < 0.05; I2 = 0.0%). Subgroup analyses were conducted based on the type of comparator: Regorafenib vs nivolumab (n = 4 studies); regorafenib vs placebo (n = 1 study). The square markers in the forest plot have been scaled according to the inverse-variance weight of each study, where larger squares indicate studies with greater statistical weight. CI: Confidence interval.
- Citation: Cheng Z, Yue AM. Efficacy of regorafenib in the treatment of advanced hepatocellular carcinoma: A systematic review and meta-analysis. World J Gastrointest Oncol 2026; 18(1): 113816
- URL: https://www.wjgnet.com/1948-5204/full/v18/i1/113816.htm
- DOI: https://dx.doi.org/10.4251/wjgo.v18.i1.113816