
















©The Author(s) 2026.
World J Gastrointest Oncol. Jan 15, 2026; 18(1): 113816
Published online Jan 15, 2026. doi: 10.4251/wjgo.v18.i1.113816
Published online Jan 15, 2026. doi: 10.4251/wjgo.v18.i1.113816
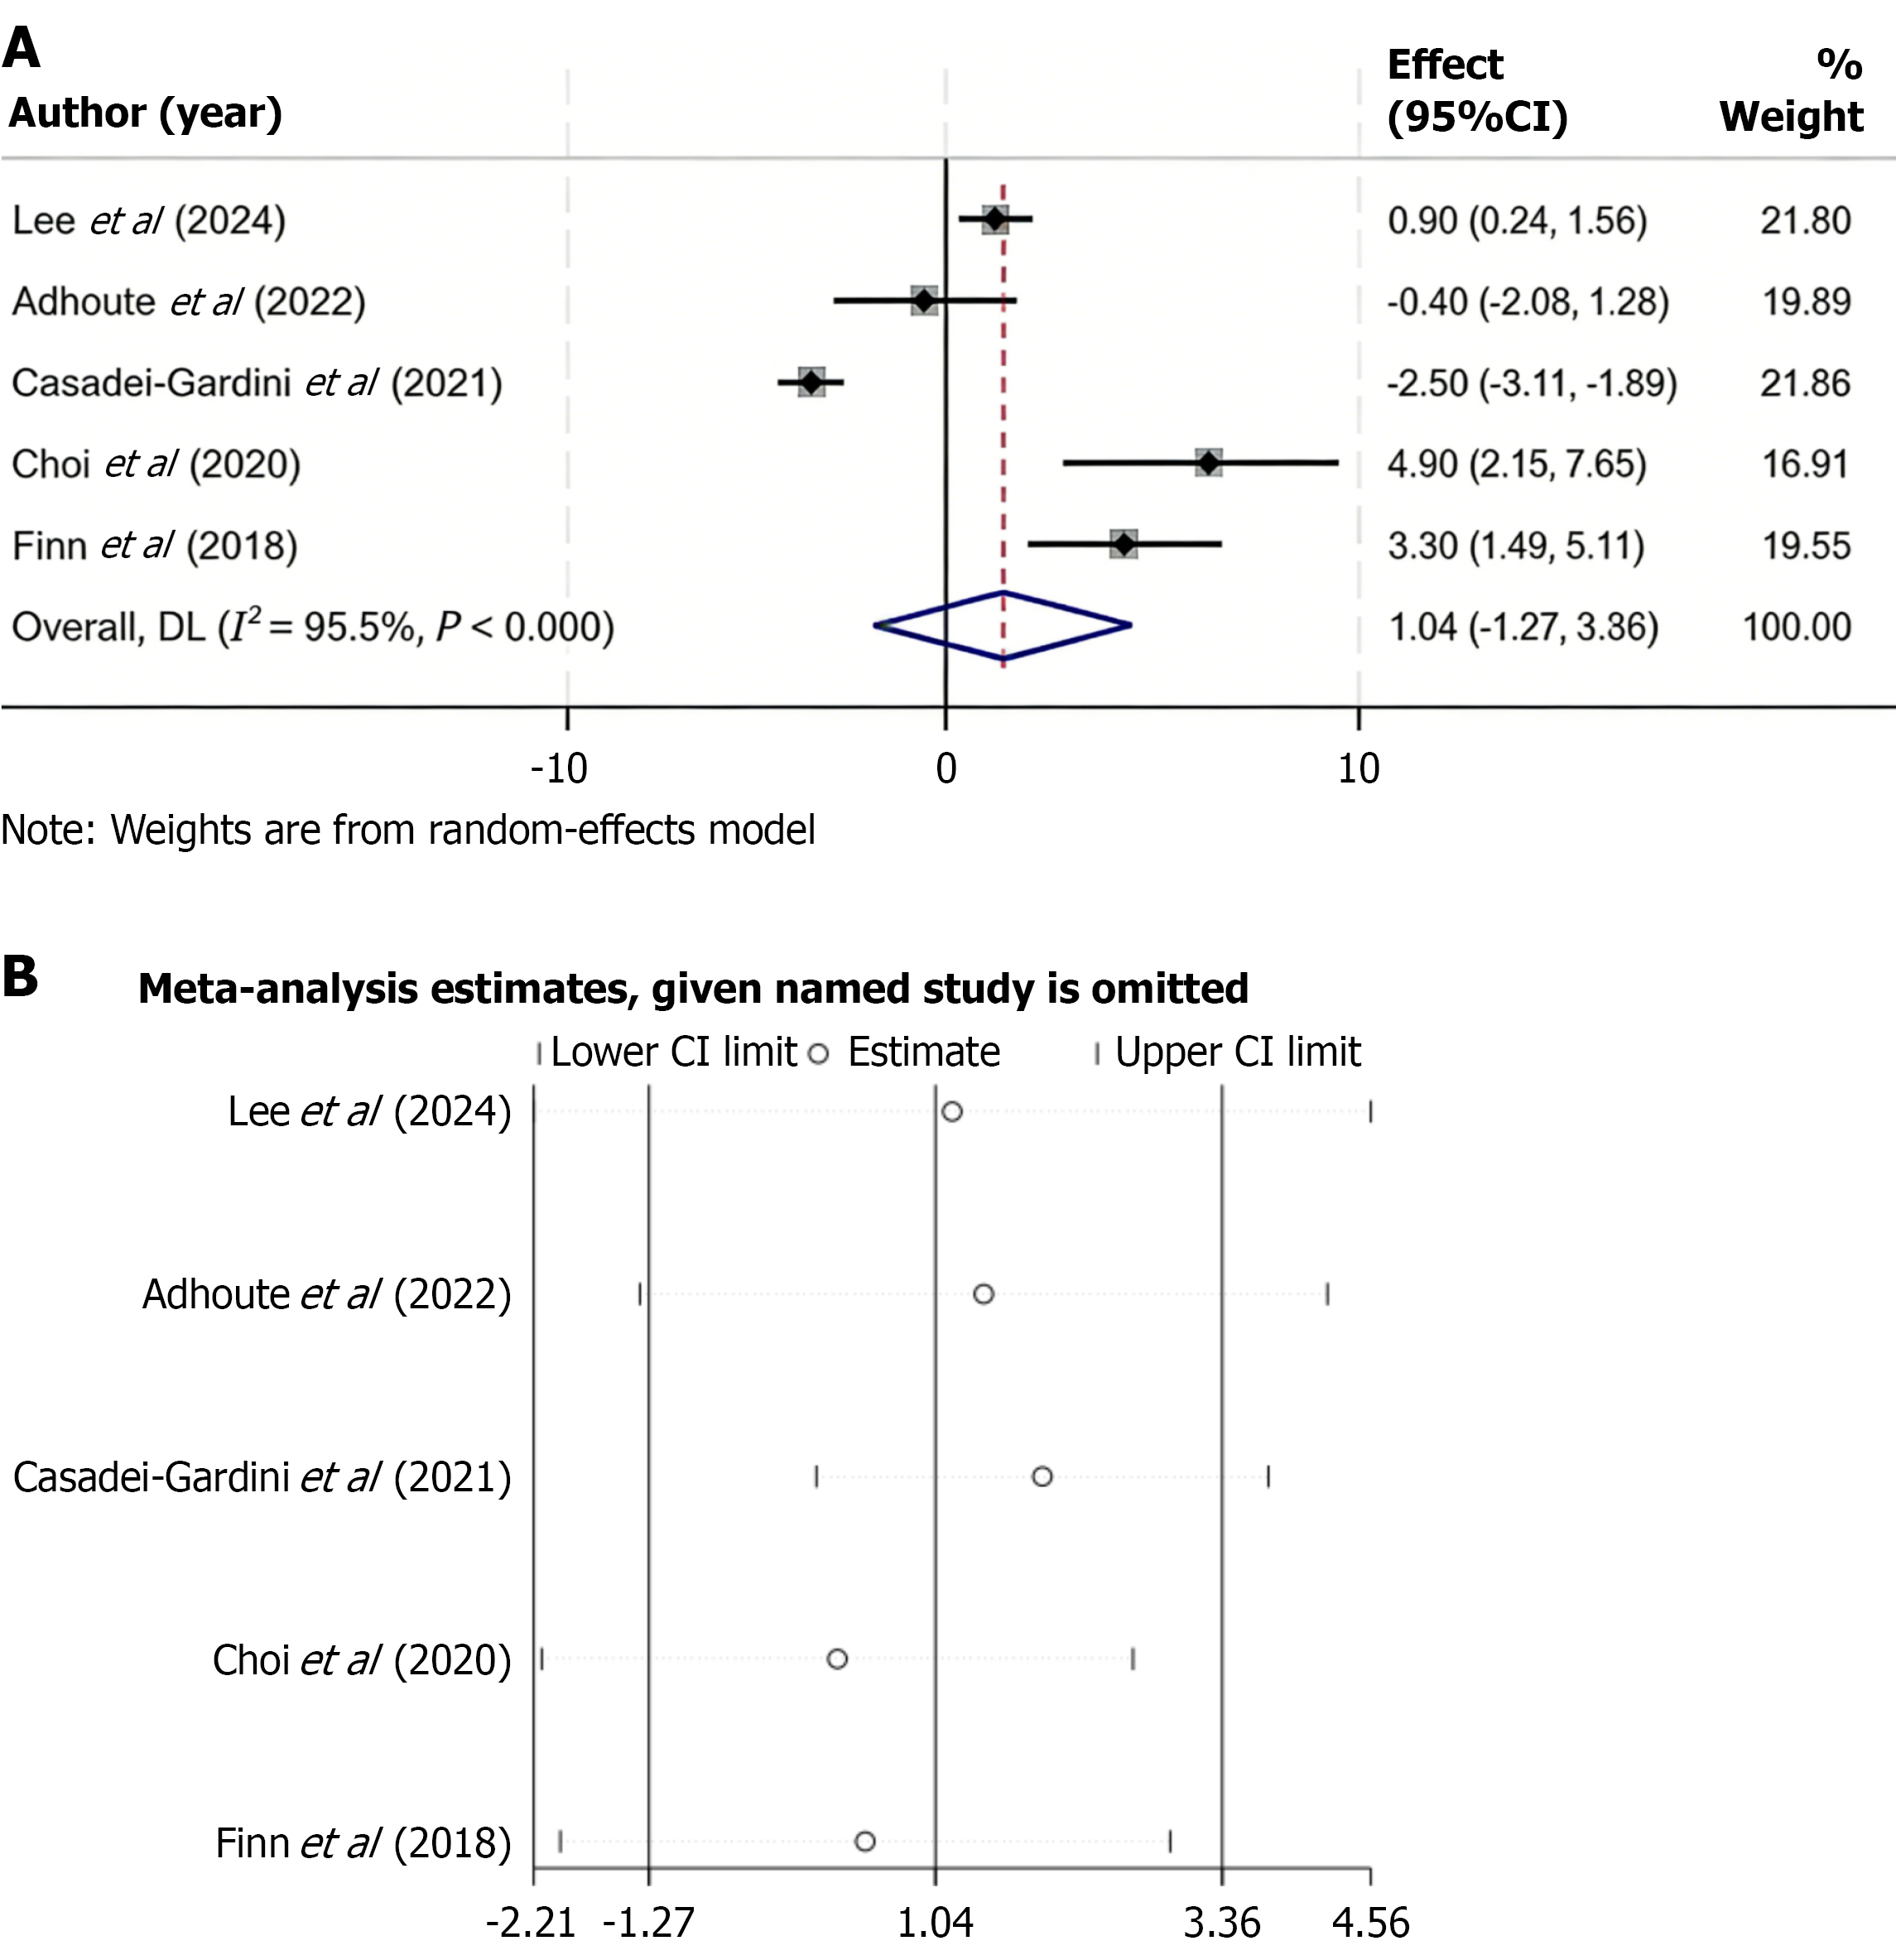
Figure 4 Progression-free survival comparison between regorafenib and control treatments and sensitivity analysis of the pooled estimate.
A: Forest plot of progression-free survival (PFS) comparing regorafenib vs control therapies. A random-effects model was applied due to substantial heterogeneity (I2 = 95.5%). No statistically significant difference in PFS was observed between groups (weighted mean difference = 1.04; 95% confidence interval: -1.27 to 3.36; P > 0.05); B: Sensitivity analysis of pooled PFS results by sequential study exclusion. The results remained stable across iterations, confirming that no individual study had a major impact on the overall pooled effect. CI: Confidence interval.
- Citation: Cheng Z, Yue AM. Efficacy of regorafenib in the treatment of advanced hepatocellular carcinoma: A systematic review and meta-analysis. World J Gastrointest Oncol 2026; 18(1): 113816
- URL: https://www.wjgnet.com/1948-5204/full/v18/i1/113816.htm
- DOI: https://dx.doi.org/10.4251/wjgo.v18.i1.113816