
















©The Author(s) 2026.
World J Gastrointest Oncol. Jan 15, 2026; 18(1): 113681
Published online Jan 15, 2026. doi: 10.4251/wjgo.v18.i1.113681
Published online Jan 15, 2026. doi: 10.4251/wjgo.v18.i1.113681
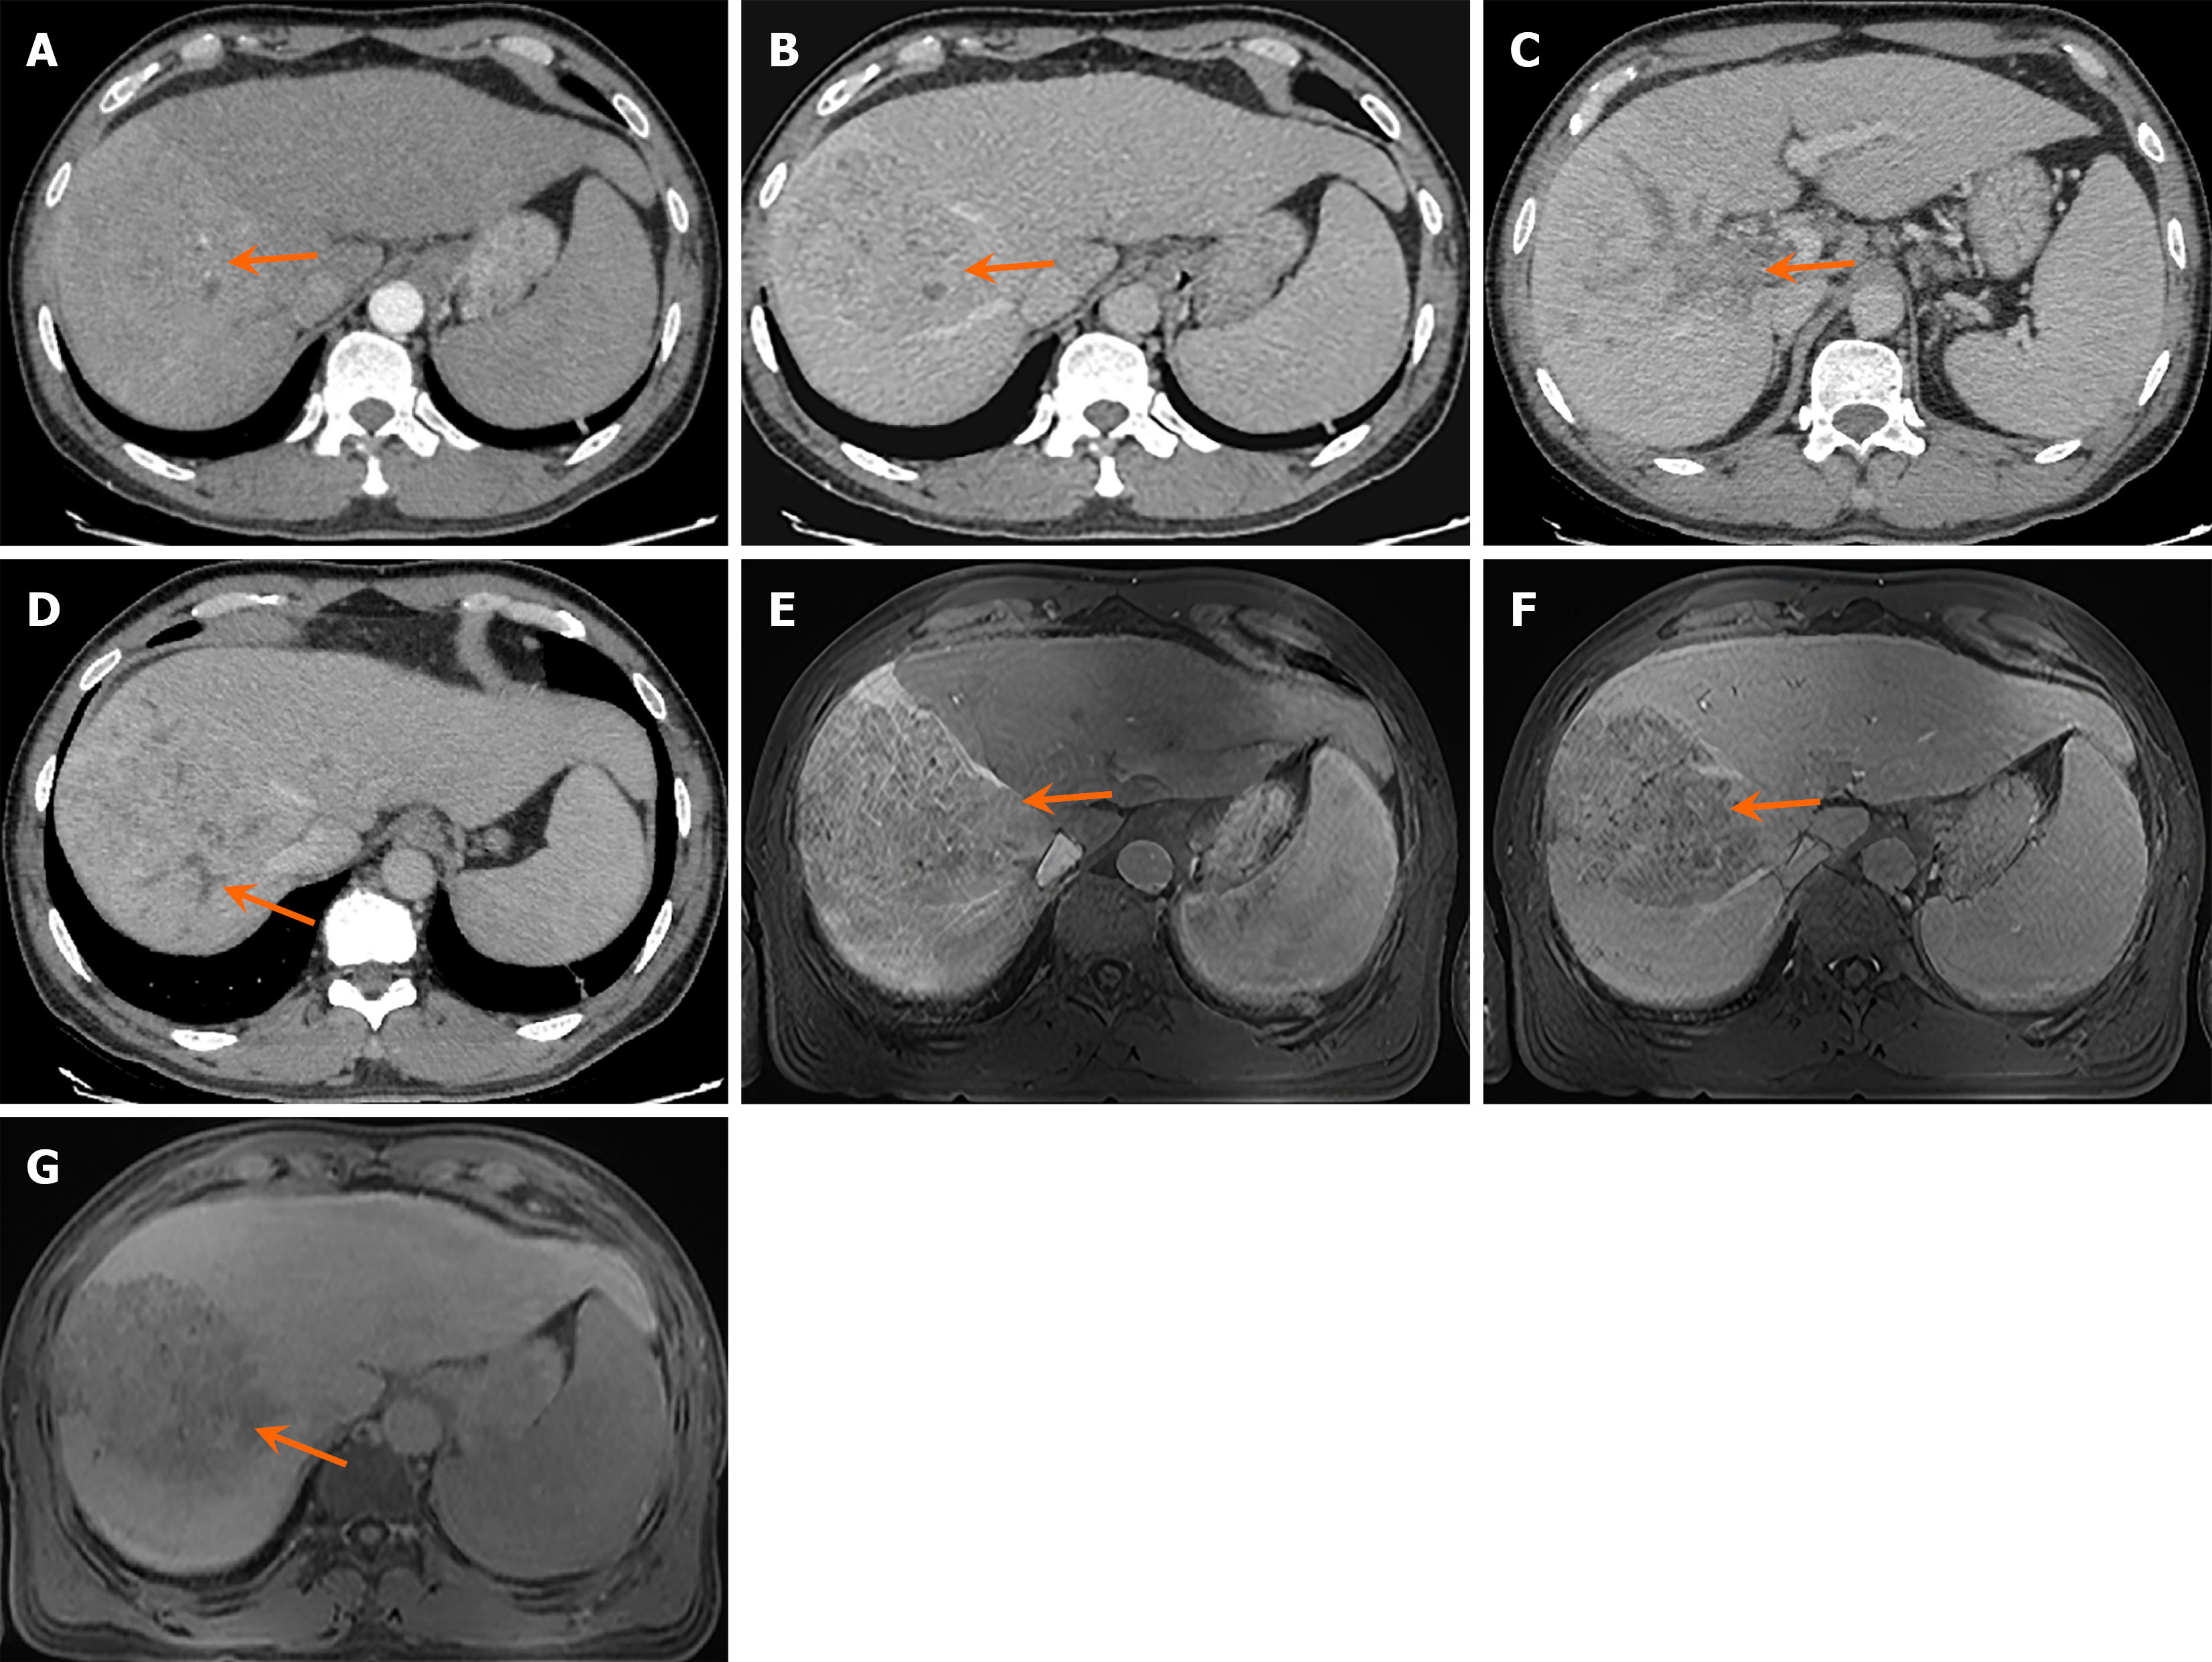
Figure 1 Imaging features of the patient.
A: Arterial phase computed tomography (CT) shows marked enhancement in the right hepatic lobe (orange arrow); B: Portal venous phase CT shows hypointensity in the right hepatic lobe (orange arrow); C: Portal venous phase CT demonstrates visualization of the left branch of the portal vein, but absence of the right branch (orange arrow), suggesting portal vein tumor thrombus; D: Intrahepatic bile duct dilatation is observed (orange arrow), indicating obstructive jaundice; E: Gadoxetic acid-enhanced magnetic resonance imaging (MRI) in the arterial phase demonstrates significant tumor enhancement (orange arrow); F: MRI in the portal/venous phase shows marked hypointensity (washout) of the tumor (orange arrow); G: MRI in the hepatobiliary phase shows marked hypointensity of the tumor due to no contrast uptake (orange arrow).
- Citation: Zhang L, Xiao P, Shi LD, Chen KX, Bing YF. Hepatic artery infusion chemotherapy for advanced hepatocellular carcinoma with obstructive jaundice: A case report and review of literature. World J Gastrointest Oncol 2026; 18(1): 113681
- URL: https://www.wjgnet.com/1948-5204/full/v18/i1/113681.htm
- DOI: https://dx.doi.org/10.4251/wjgo.v18.i1.113681