
















©The Author(s) 2025.
World J Gastrointest Oncol. Sep 15, 2025; 17(9): 110981
Published online Sep 15, 2025. doi: 10.4251/wjgo.v17.i9.110981
Published online Sep 15, 2025. doi: 10.4251/wjgo.v17.i9.110981
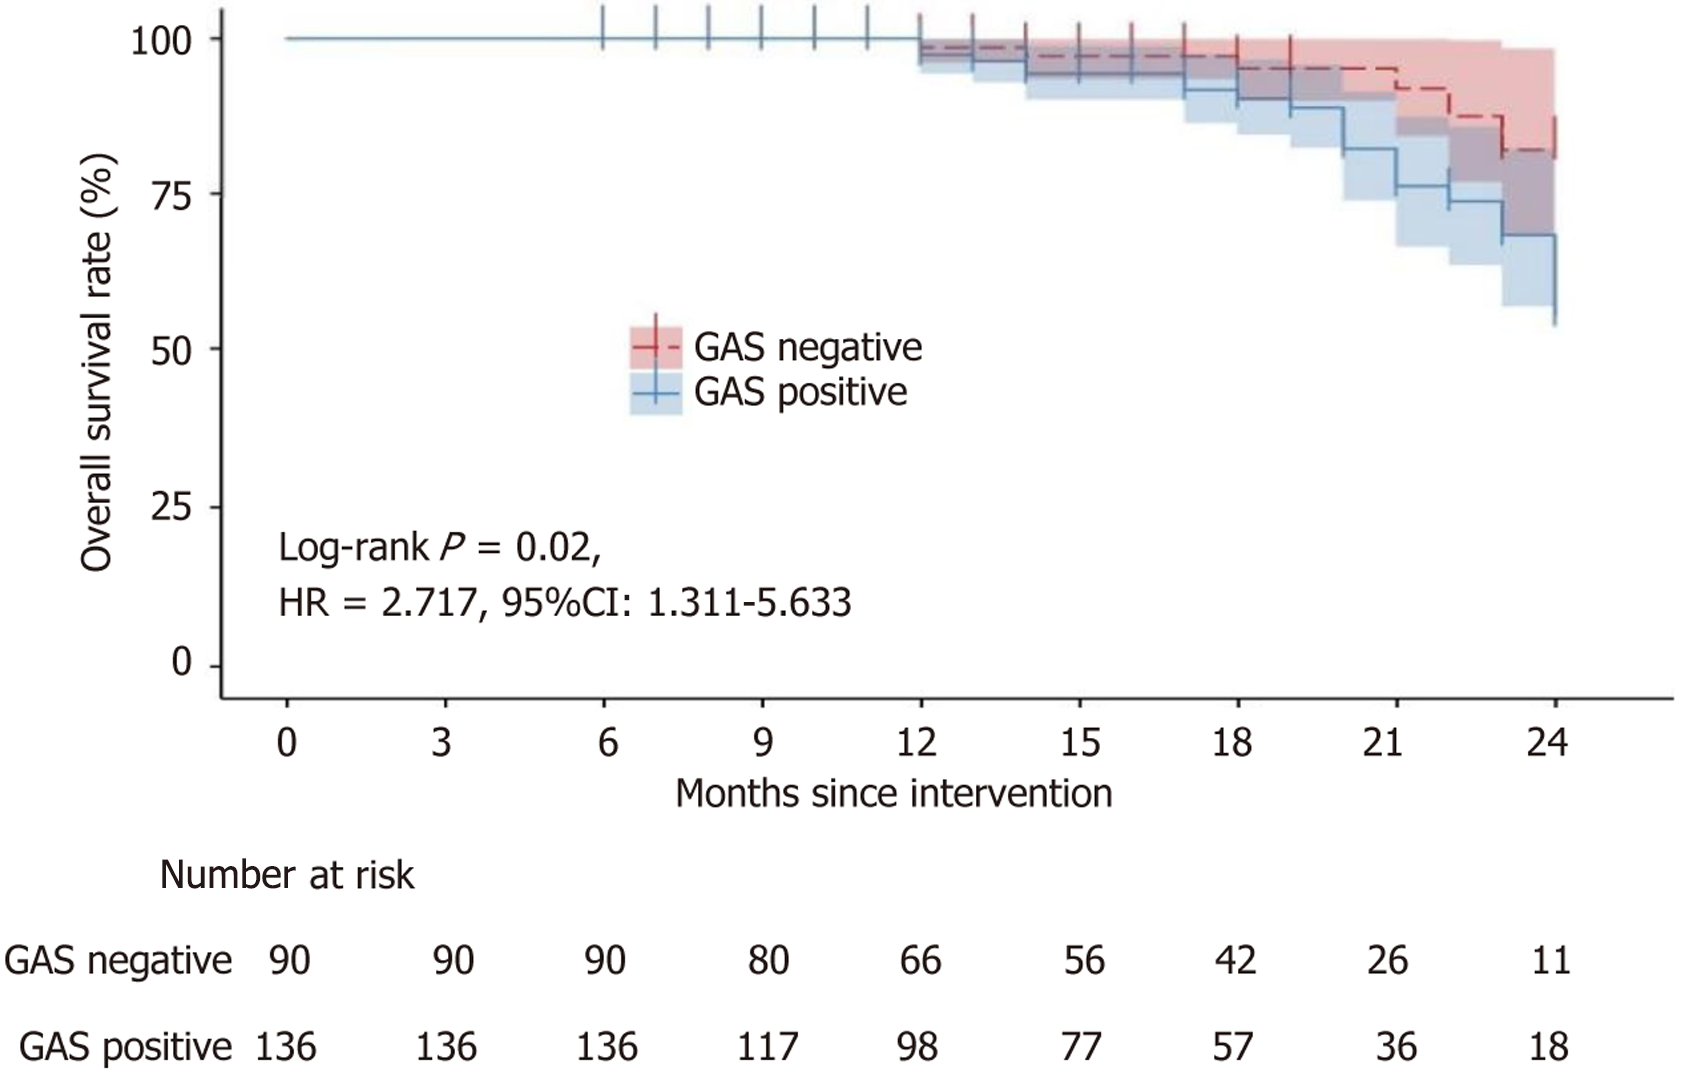
Figure 2 Kaplan-Meier curve for overall survival Kaplan-Meier analysis comparing overall survival between gastrin-positive and gastrin-negative gastric cancer patients.
Gastrin-positive patients showed significantly worse overall survival (hazard ratio = 2.717; 95% confidence interval: 1.311-5.633; P < 0.01). HR: Hazard ratio; CI: Confidence interval; GAS: Gastrin.
- Citation: Huang JW, Lin C, Lu CJ, Wang HS, Zou DD. Serum gastrin and Helicobacter pylori infection correlate with tumor aggressiveness and prognosis in gastric cancer. World J Gastrointest Oncol 2025; 17(9): 110981
- URL: https://www.wjgnet.com/1948-5204/full/v17/i9/110981.htm
- DOI: https://dx.doi.org/10.4251/wjgo.v17.i9.110981