
















©The Author(s) 2025.
World J Gastrointest Oncol. Sep 15, 2025; 17(9): 109949
Published online Sep 15, 2025. doi: 10.4251/wjgo.v17.i9.109949
Published online Sep 15, 2025. doi: 10.4251/wjgo.v17.i9.109949
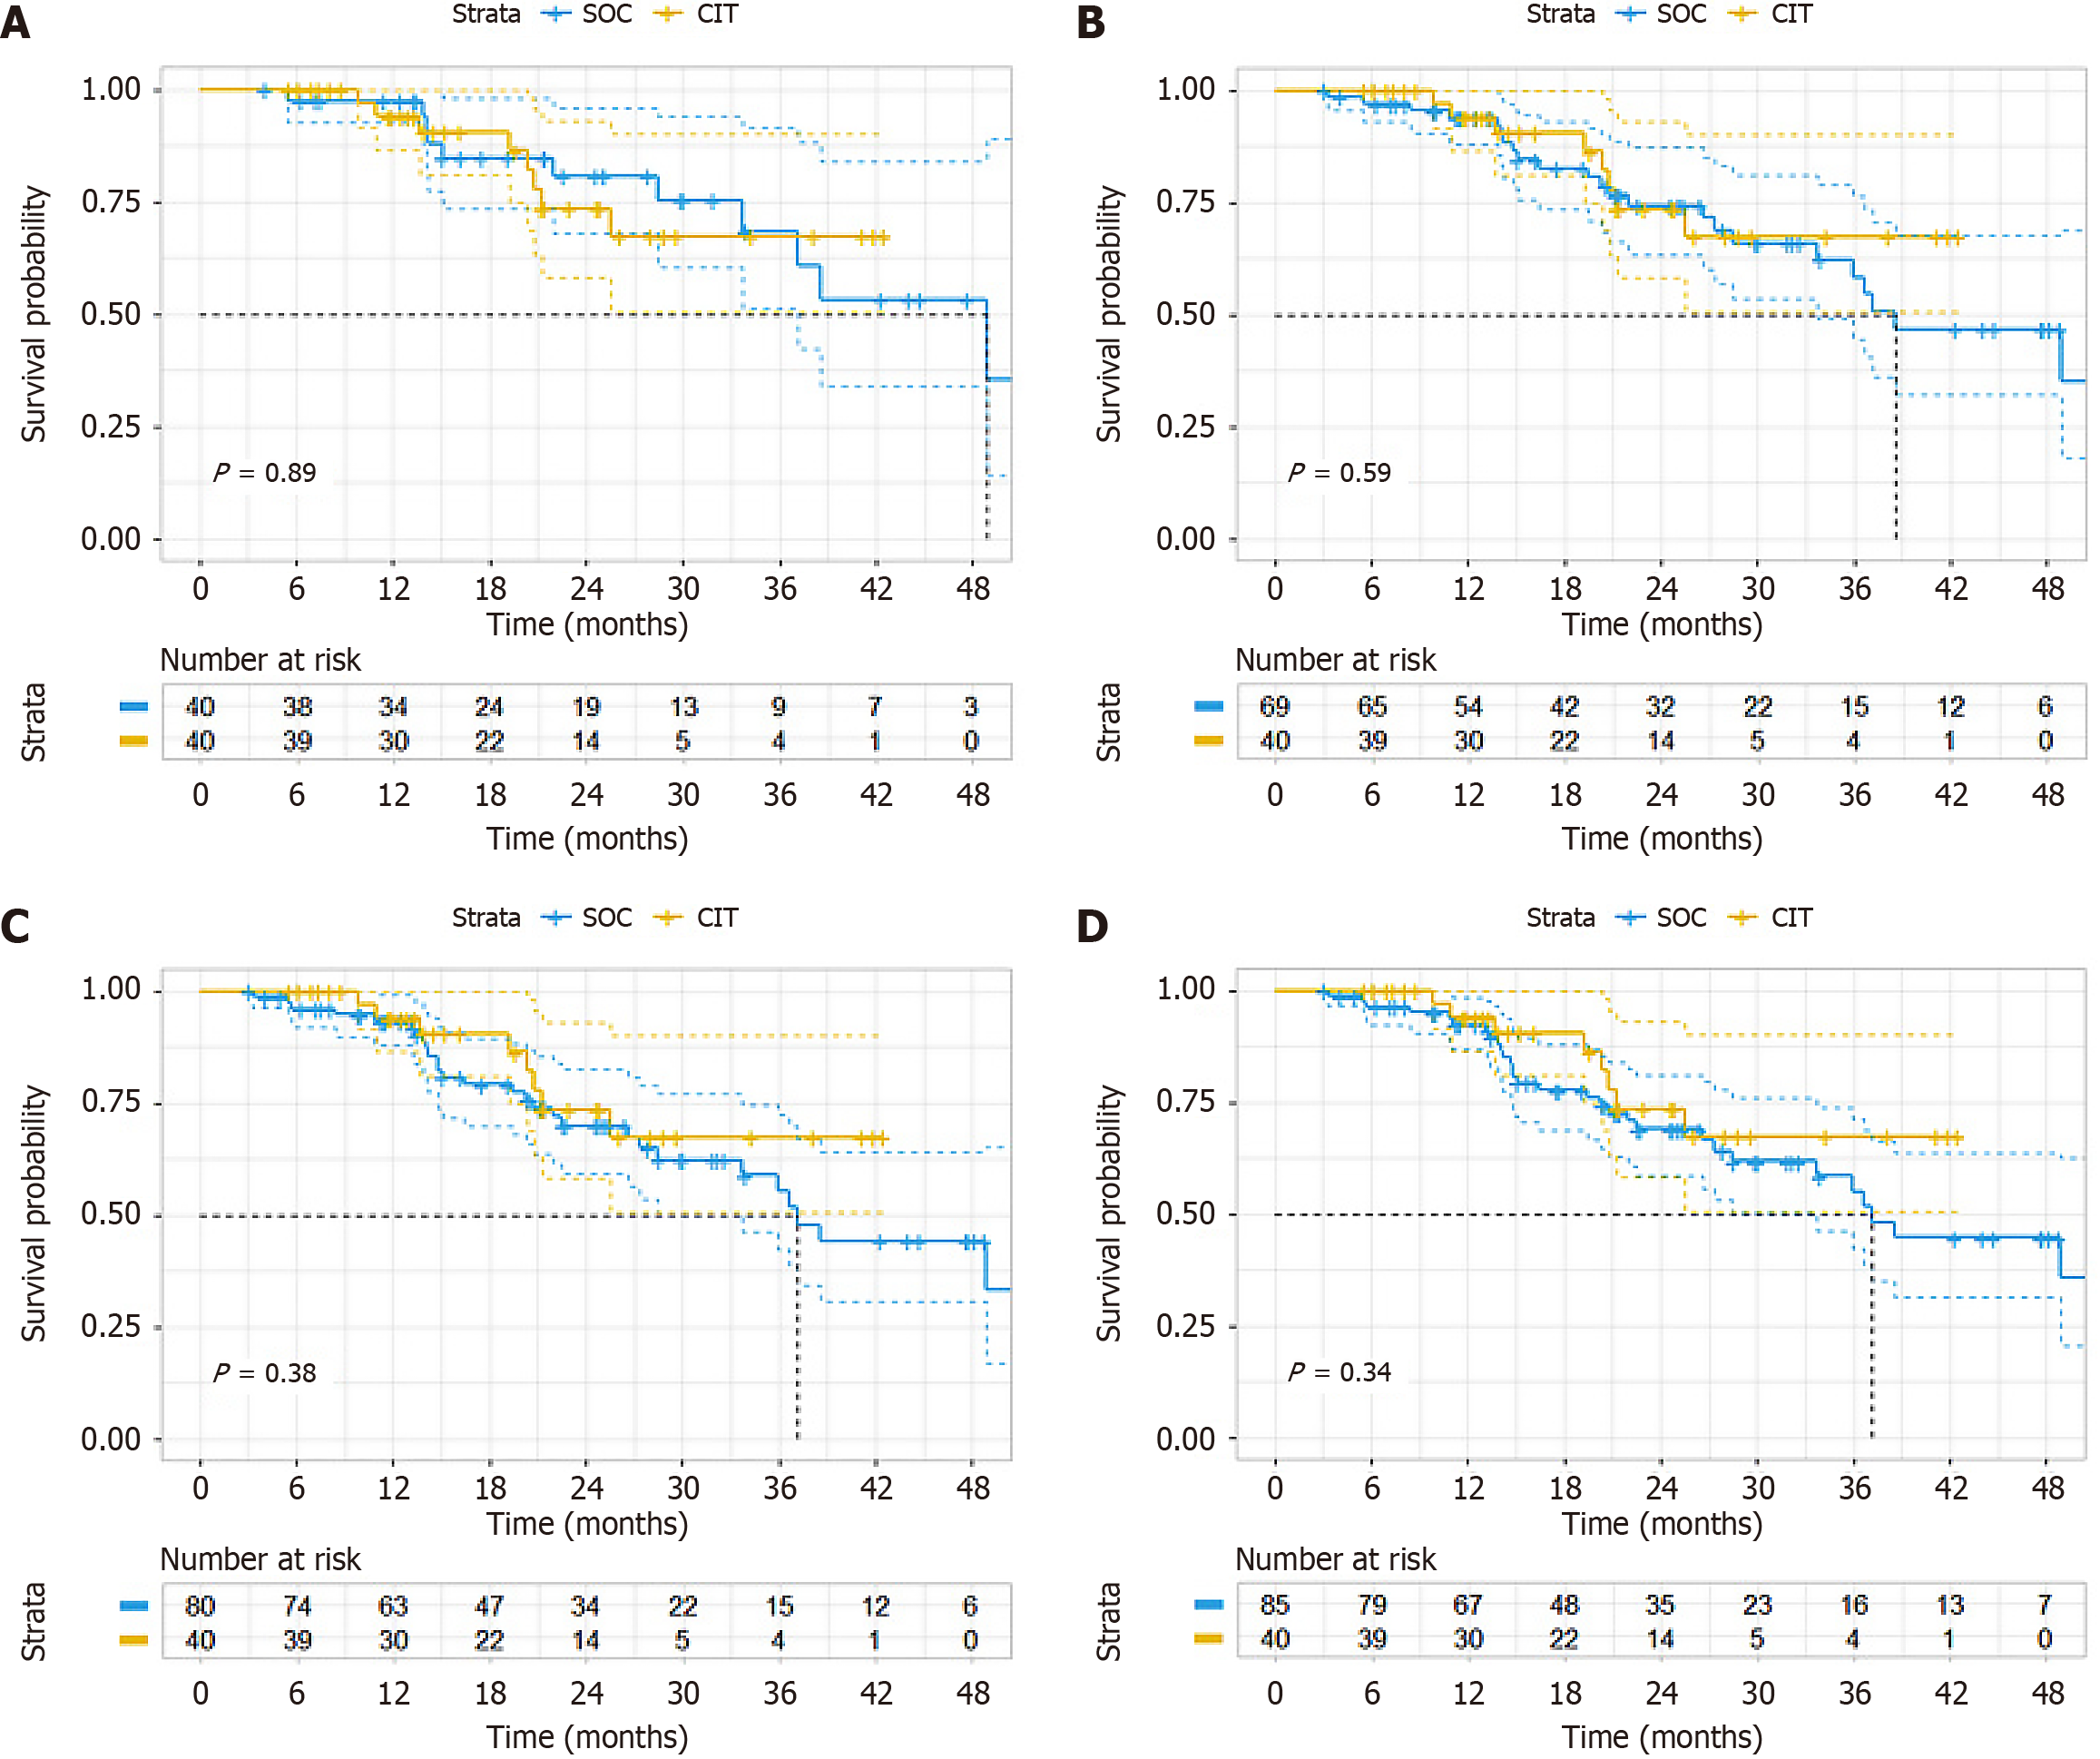
Figure 3 Overall survival sensitivity analysis.
A: After propensity score matching (PSM) analysis of overall survival (OS) (ratio = 1); B: After PSM analysis of OS (ratio = 2); C: After PSM analysis of OS (ratio = 3); D: After PSM analysis of OS (ratio = 4). SOC: Standard-of-care; CIT: Chemoimmunotherapy.
- Citation: Gao Z, Zhou ZF, Wang XY, Song T, Wu SK, Jin X. Chemotherapy plus bevacizumab vs chemoimmunotherapy for metastatic colorectal cancer: Real-world analysis. World J Gastrointest Oncol 2025; 17(9): 109949
- URL: https://www.wjgnet.com/1948-5204/full/v17/i9/109949.htm
- DOI: https://dx.doi.org/10.4251/wjgo.v17.i9.109949