
















©The Author(s) 2025.
World J Gastrointest Oncol. Sep 15, 2025; 17(9): 109777
Published online Sep 15, 2025. doi: 10.4251/wjgo.v17.i9.109777
Published online Sep 15, 2025. doi: 10.4251/wjgo.v17.i9.109777
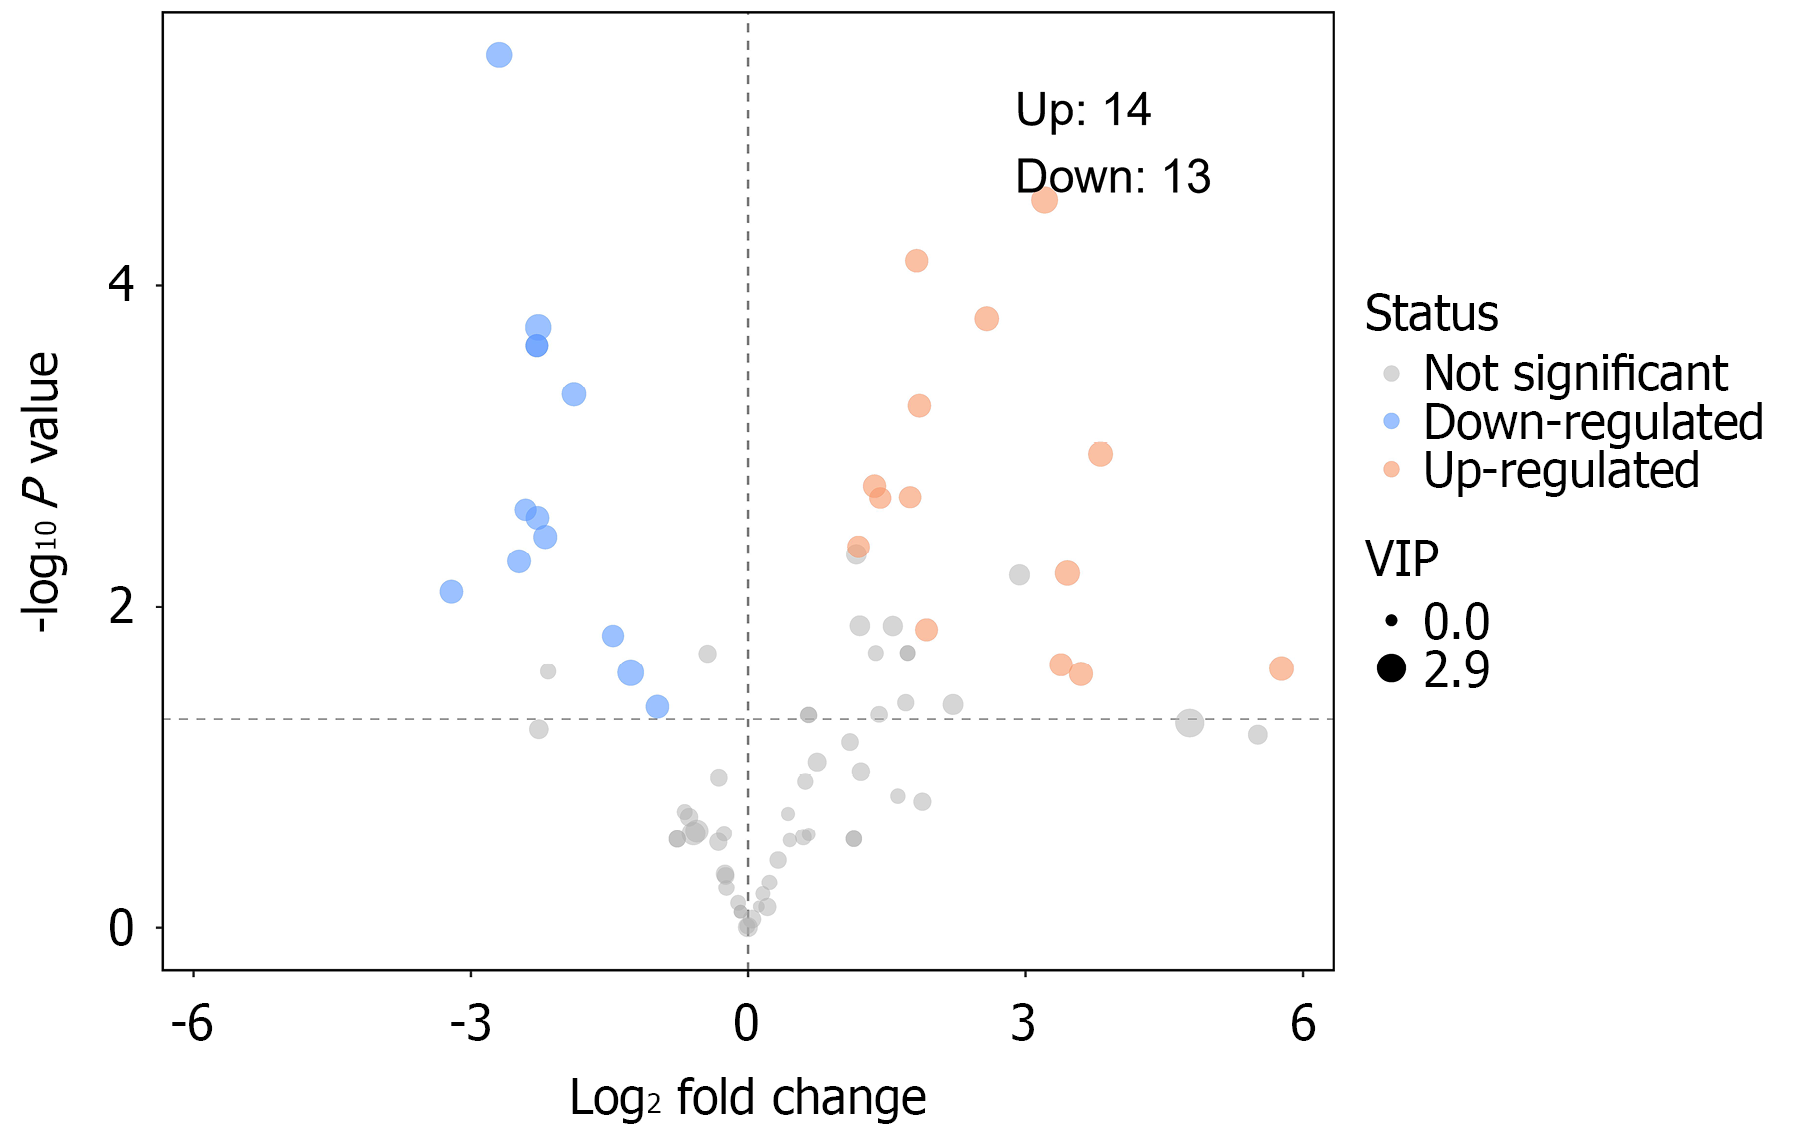
Figure 6 Each point in the volcano plot represents a peak.
The horizontal axis indicates the fold change (log2-transformed) between groups, and the vertical axis shows the t-test P value (negative log10-transformed). Point size reflects the VIP value of the orthogonal partial least squares discriminant analysis model; larger points indicate higher VIP values. Significantly upregulated metabolites are shown in red, downregulated metabolites in blue, and nonsignificant metabolites in gray.
- Citation: Zhu LH, Jin ZX, Ma YQ, Feng X, Ci CH, Zhou YS, Gu QL, Lan YM, Zhang ZL. Untargeted metabolomics analysis of metabolite changes in gastric cancer patients from plateau regions. World J Gastrointest Oncol 2025; 17(9): 109777
- URL: https://www.wjgnet.com/1948-5204/full/v17/i9/109777.htm
- DOI: https://dx.doi.org/10.4251/wjgo.v17.i9.109777