
















©The Author(s) 2025.
World J Gastrointest Oncol. Sep 15, 2025; 17(9): 109777
Published online Sep 15, 2025. doi: 10.4251/wjgo.v17.i9.109777
Published online Sep 15, 2025. doi: 10.4251/wjgo.v17.i9.109777
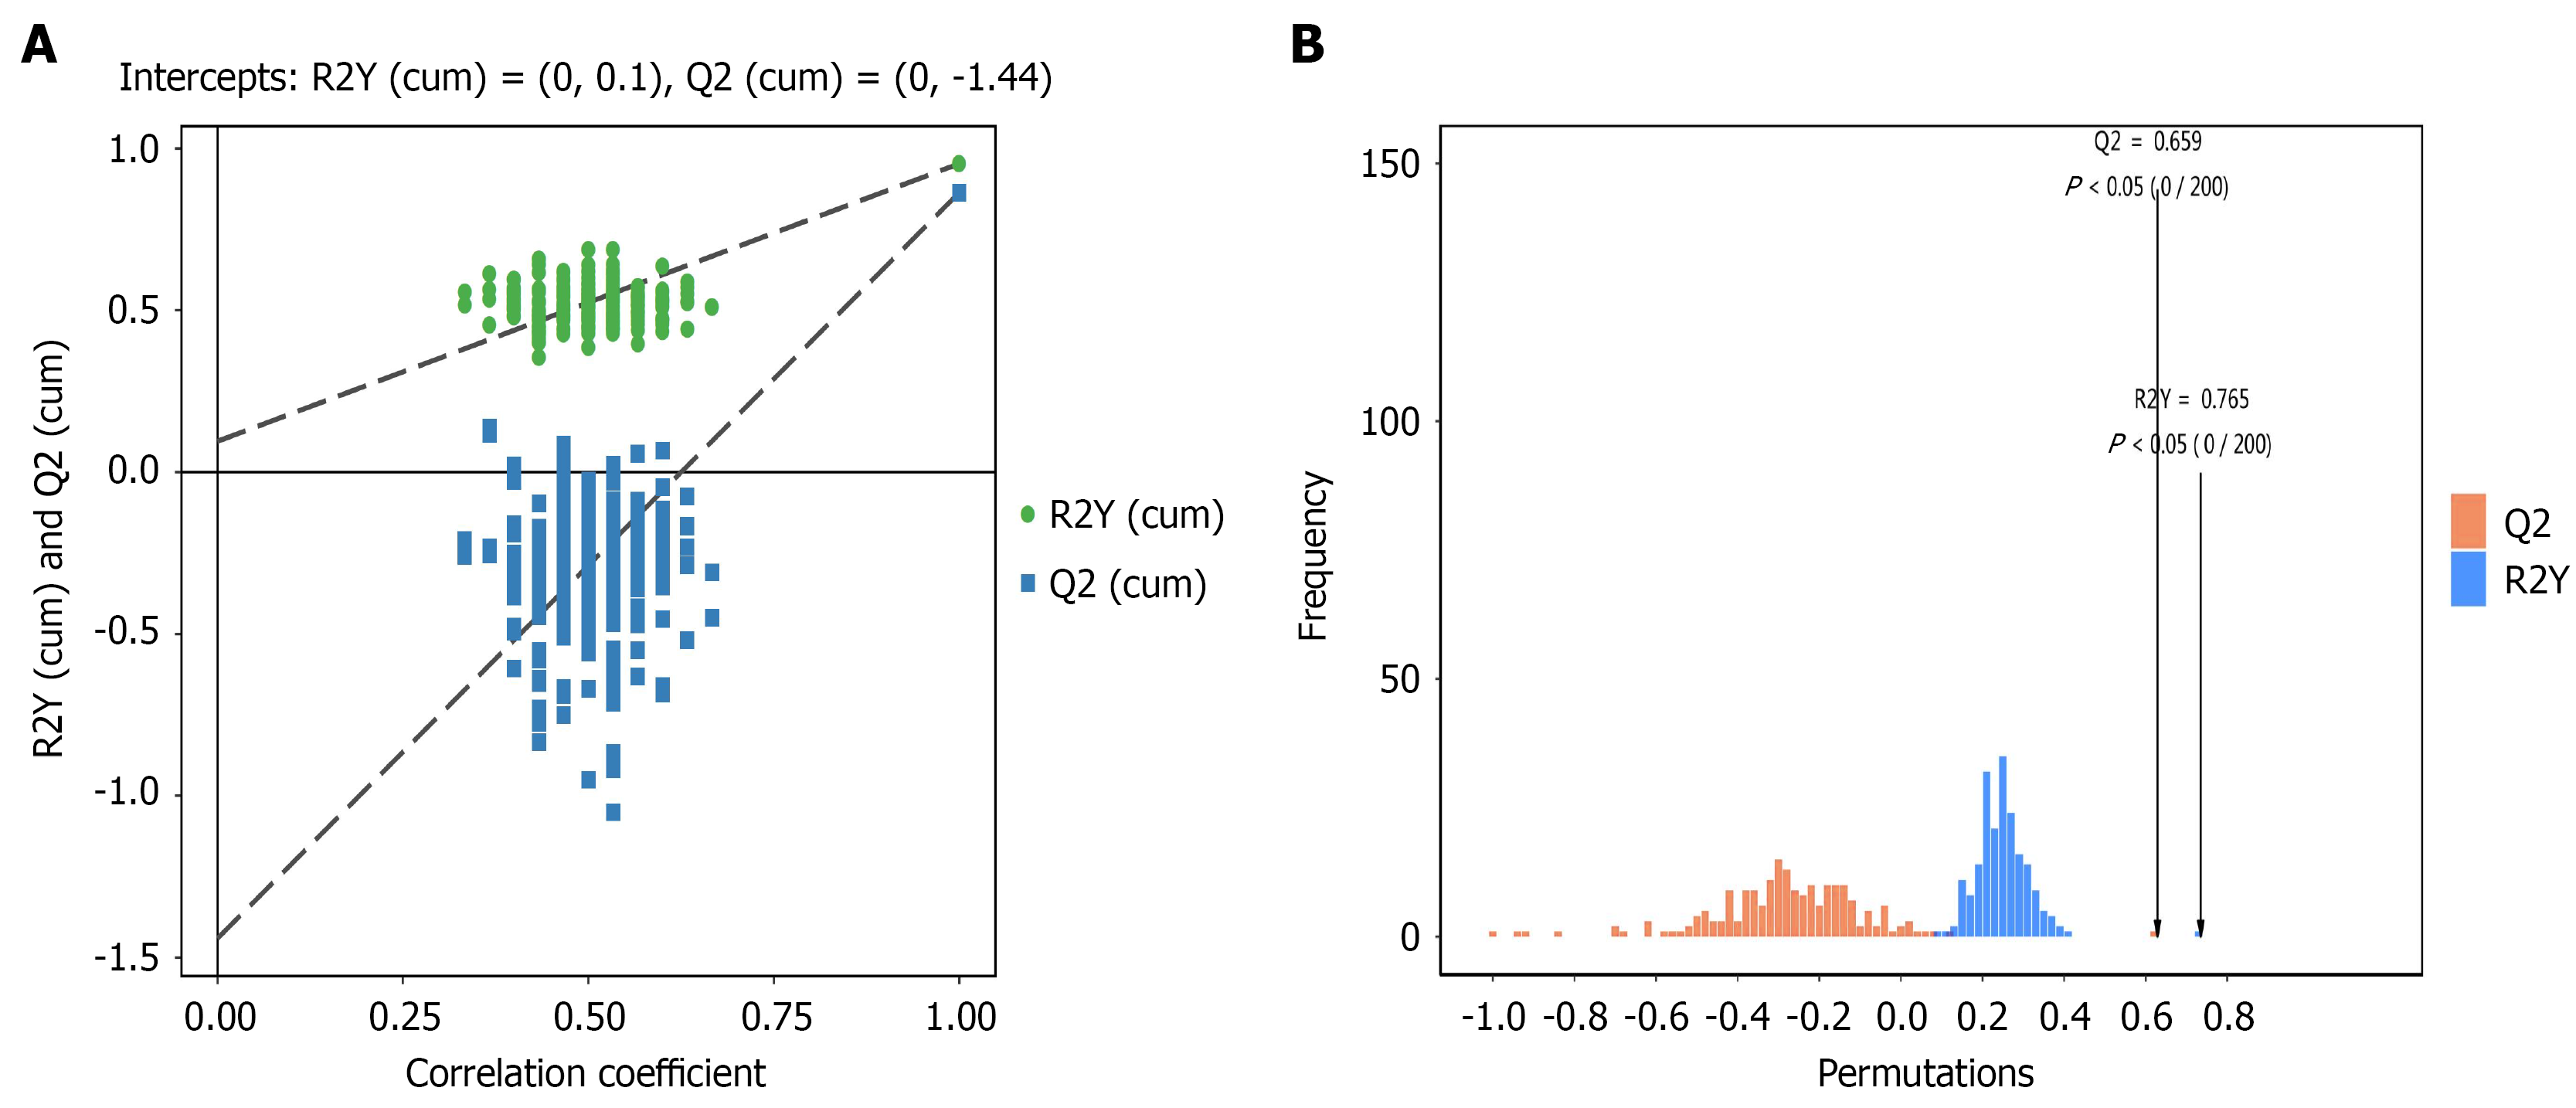
Figure 5 Fecal metabolomics analysis of orthogonal partial least squares discriminant analysis between gastric cancer group and healthy group.
A: Permutation plot test results of the orthogonal partial least squares discriminant analysis (OPLS-DA) model comparison between healthy group (CK) and gastric cancer group (DG) groups (permutation plot test of OPLS-DA model for group CK vs DG). The X-axis shows the permutation retention (proportion consistent with the original model's Y variable order, where a point at 1 represents the original model's R2Y and Q2 values), while the Y-axis displays the values of R2Y or Q2. Green dots indicate the permutation test-derived R2Y values, blue squares represent the permutation test-derived Q2 values, and two dashed lines show the regression lines for R2Y and Q2; B: Permutation histogram test results for the OPLS-DA model comparison between CK and DG groups (CK vs DG). The X-axis shows the accuracy rate of the randomized model in permutation tests, while the Y-axis indicates the number of random models. Red bars represent the frequency of Q values obtained through permutation tests, and blue bars show the occurrence count of RY values. P < 0.05 indicates optimal model performance.
- Citation: Zhu LH, Jin ZX, Ma YQ, Feng X, Ci CH, Zhou YS, Gu QL, Lan YM, Zhang ZL. Untargeted metabolomics analysis of metabolite changes in gastric cancer patients from plateau regions. World J Gastrointest Oncol 2025; 17(9): 109777
- URL: https://www.wjgnet.com/1948-5204/full/v17/i9/109777.htm
- DOI: https://dx.doi.org/10.4251/wjgo.v17.i9.109777