
















©The Author(s) 2025.
World J Gastrointest Oncol. Sep 15, 2025; 17(9): 109777
Published online Sep 15, 2025. doi: 10.4251/wjgo.v17.i9.109777
Published online Sep 15, 2025. doi: 10.4251/wjgo.v17.i9.109777
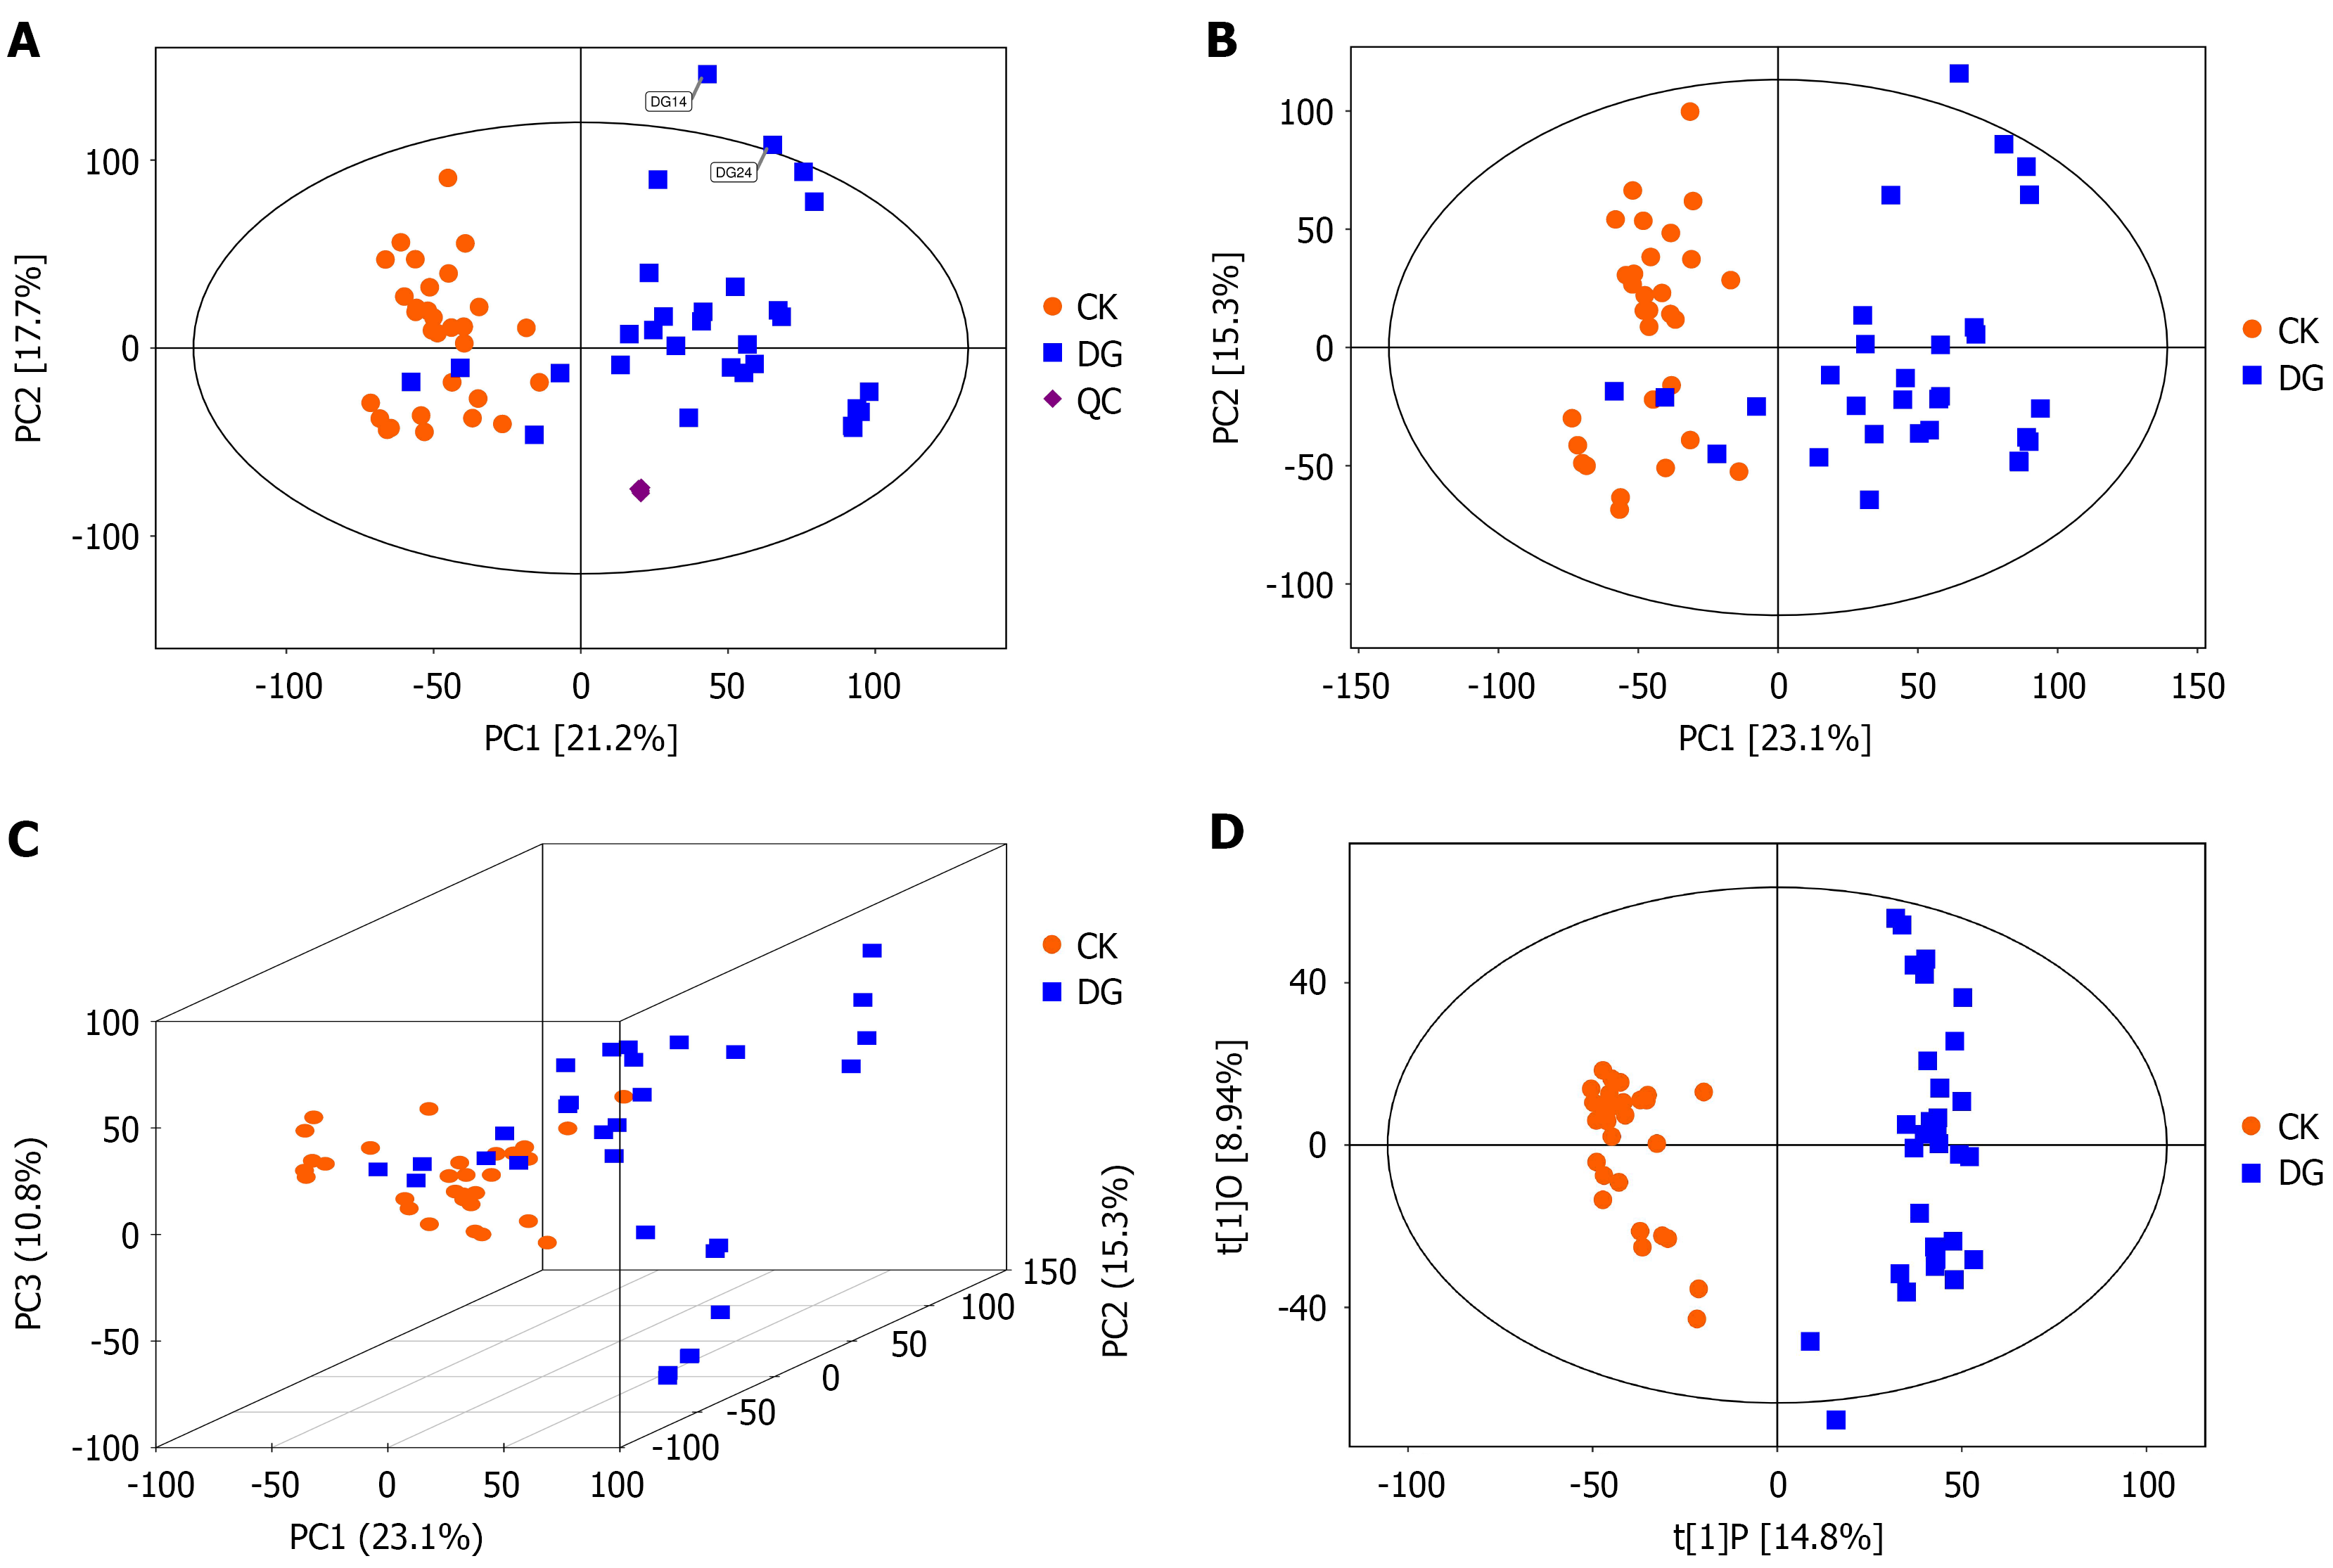
Figure 4 Principal component analysis score scatter plot for all samples (including quality control samples).
A: The principal component analysis (PCA) score scatter plot [score scatter plot for PCA model total with quality control (QC)] of all samples (including QC samples) shows the first principal component (PC1) on the horizontal axis and the second principal component (PC2) on the vertical axis. Each scatter point represents a sample, with color and shape indicating different groups. The closer the sample points are distributed, the more similar the types and concentrations of metabolites in the samples; conversely, the farther apart the samples are, the greater the overall metabolic differences. Most samples fall within the 95% confidence interval (Hotelling’s T-squared ellipse). Observing the PCA score plot of all samples reveals the overall distribution trend of the samples; B: Score scatter plot of PCA model for healthy group (CK) vs gastric cancer group (DG). The results from the PCA score plot indicate that the samples are mostly within the 95% confidence interval (Hotelling’s T-squared ellipse); C: Score scatter plot 3D of PCA model for group CK vs DG; D: Score scatter plot of orthogonal partial least squares discriminant analysis model for group CK vs DG. In the plot, the horizontal axis t[1]P represents the predicted principal component scores of the first principal component, displaying inter-group differences among sample groups. The vertical axis t[1]O represents the orthogonal principal component scores, showing intra-group variations within sample groups. Each scatter point represents an individual sample, with point shapes and colors indicating different experimental groupings. Greater horizontal distance between samples reflects larger inter-group differences, while closer vertical distance indicates better intra-group reproducibility. CK: Healthy group; DG: Gastric cancer group; QC: Quality control.
- Citation: Zhu LH, Jin ZX, Ma YQ, Feng X, Ci CH, Zhou YS, Gu QL, Lan YM, Zhang ZL. Untargeted metabolomics analysis of metabolite changes in gastric cancer patients from plateau regions. World J Gastrointest Oncol 2025; 17(9): 109777
- URL: https://www.wjgnet.com/1948-5204/full/v17/i9/109777.htm
- DOI: https://dx.doi.org/10.4251/wjgo.v17.i9.109777