
















©The Author(s) 2025.
World J Gastrointest Oncol. Sep 15, 2025; 17(9): 109378
Published online Sep 15, 2025. doi: 10.4251/wjgo.v17.i9.109378
Published online Sep 15, 2025. doi: 10.4251/wjgo.v17.i9.109378
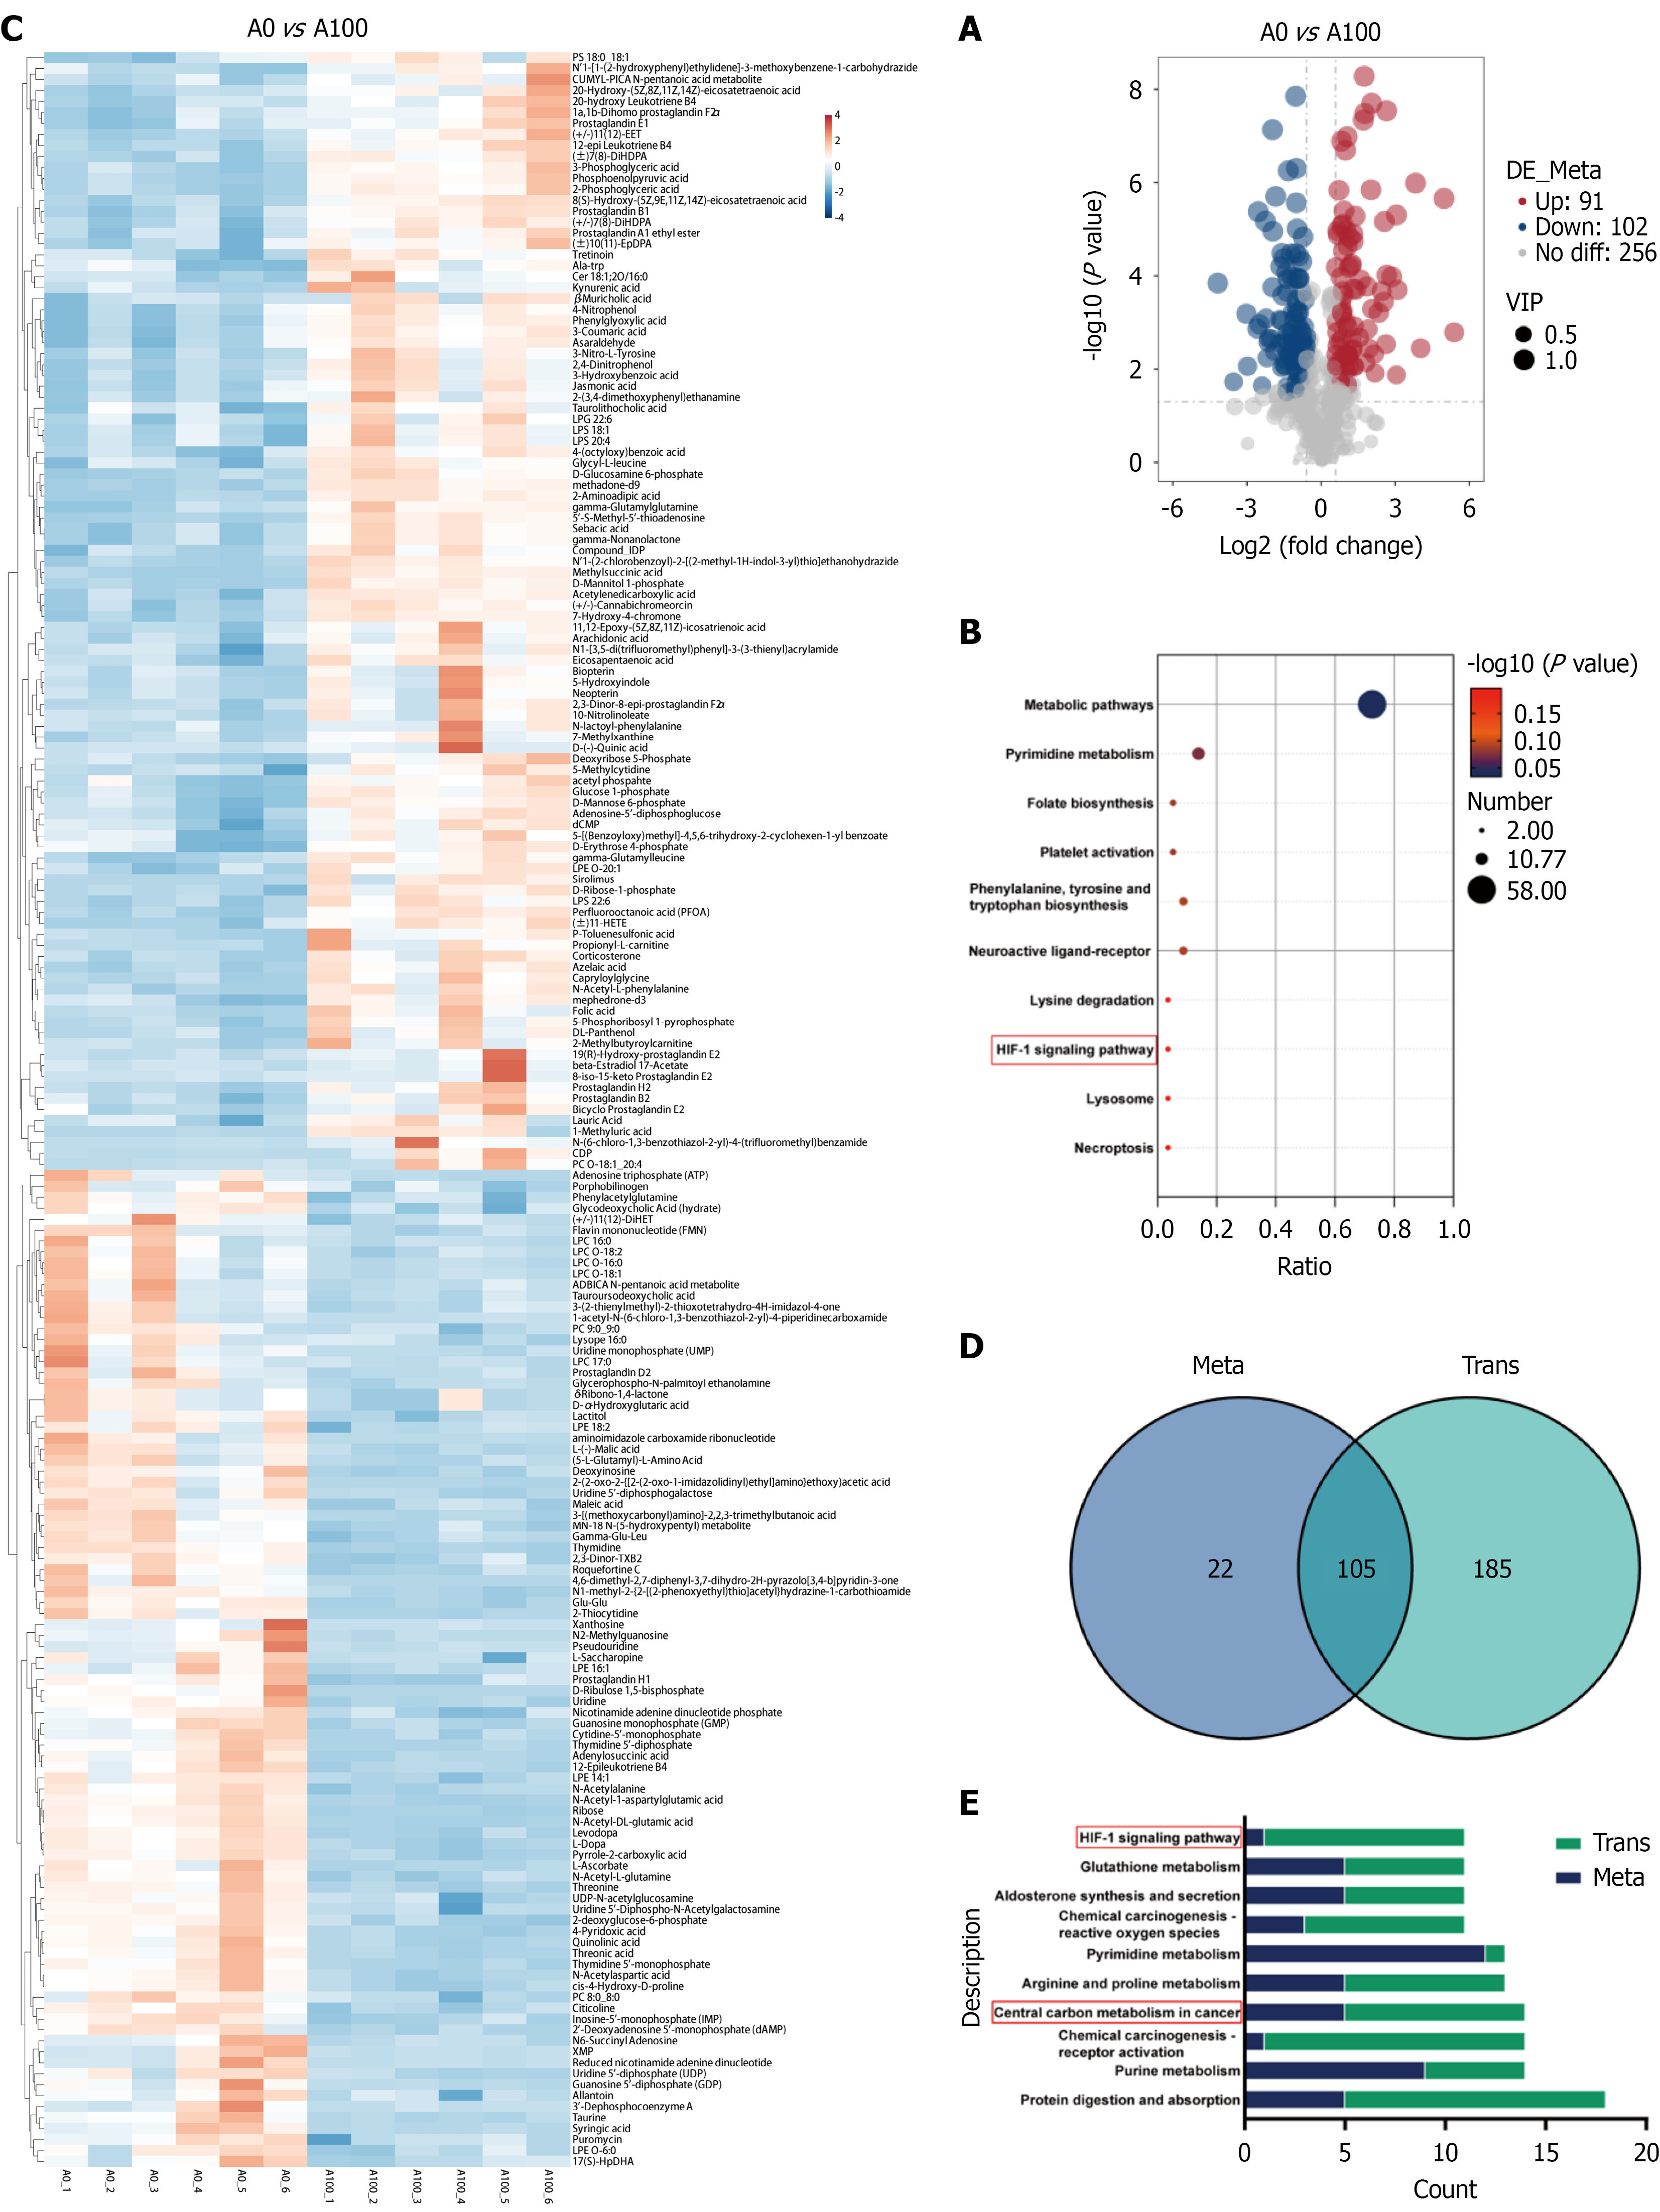
Figure 5 Metabolome results of rapamycin treatment with HUTU 80 cells and combined omics analysis.
A: Volcano plot demonstrated the quantity of different metabolites; B: Kyoto Encyclopedia of Genes and Genomes (KEGG) enrichment analysis revealed the top 10 metabolomic pathways related to antitumor effects; C: Heatmap displayed differential metabolites; D: Venn diagram revealed the number of KEGG pathways commonly annotated by different molecules in the transcriptome and metabolome; E: Bar graph displaying the top 10 KEGG pathways with the total number of differential molecules related to anti-cancer properties selected from two groups (number of different genes and number of different metabolites). VIP: Variable importance in projection; HIF-1α: Hypoxia-inducible factor-1α.
- Citation: Pu BP, Wang PH, Guo KK, Liu C, Chen SR, Li XM, Chen SM, Zeng XZ, Gao C. Rapamycin suppresses small bowel adenocarcinoma HUTU 80 cells proliferation by inhibiting hypoxia-inducible factor-1α mediated metabolic reprogramming. World J Gastrointest Oncol 2025; 17(9): 109378
- URL: https://www.wjgnet.com/1948-5204/full/v17/i9/109378.htm
- DOI: https://dx.doi.org/10.4251/wjgo.v17.i9.109378