
















©The Author(s) 2025.
World J Gastrointest Oncol. Sep 15, 2025; 17(9): 109127
Published online Sep 15, 2025. doi: 10.4251/wjgo.v17.i9.109127
Published online Sep 15, 2025. doi: 10.4251/wjgo.v17.i9.109127
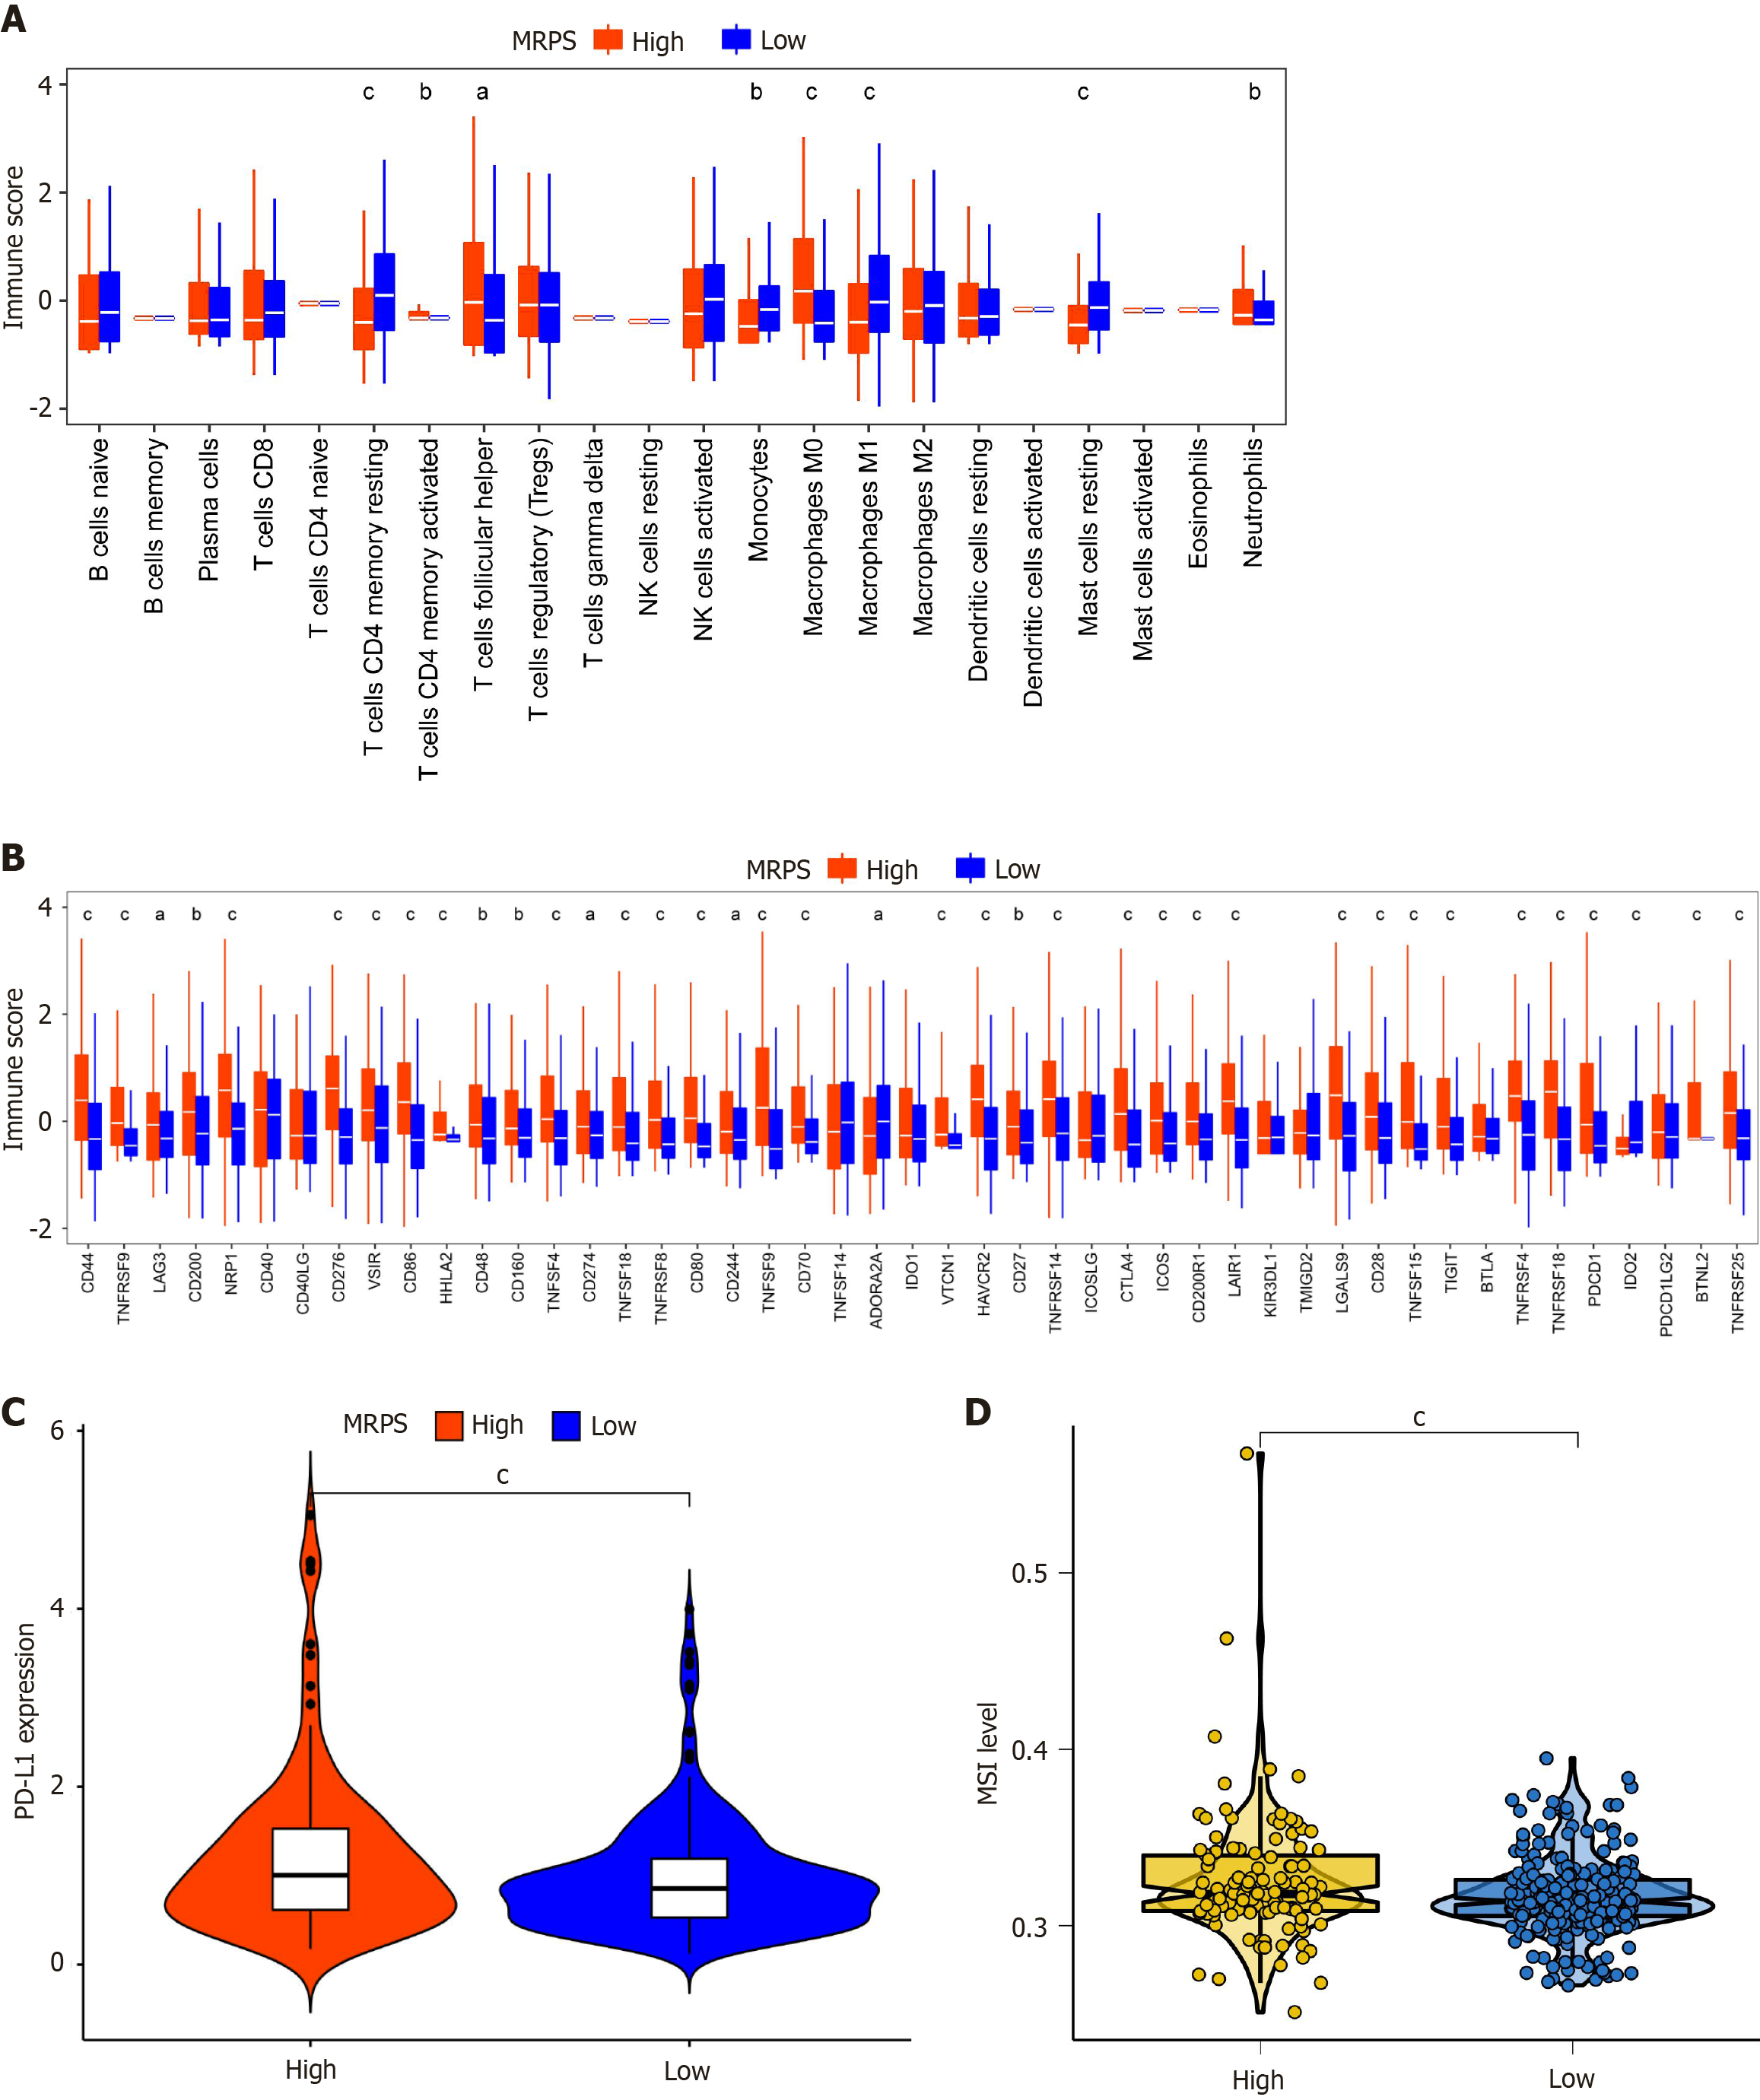
Figure 9 Comparison of immune microenvironment between different MRPS subgroups.
A: Panel illustrates the comparison of immune cell infiltration between different MRPS groups, showing differential levels of various immune cell types; B: Panel depicts the immune checkpoint analysis in high and low MRPS groups; C: Panel displays the differential expression of PD-L1 in high and low MRPS groups; D: Panel illustrates the differential microsatellite instability levels in high and low MRPS groups. aP < 0.05, bP < 0.01, and cP < 0.001.
- Citation: Bu HY, Huang H, Li J, Huang ZB, Huang Y, Huang YK, Wang AM, Wu L, Yuan J, Wang RJ, Lu M, Yu SM, Yi PP, Chen YY, Jiang YP, Hu XW. Methionyl-tRNA synthetase 1 participates in hepatocellular carcinoma and its regulated gene profile possesses potent prognostic ability. World J Gastrointest Oncol 2025; 17(9): 109127
- URL: https://www.wjgnet.com/1948-5204/full/v17/i9/109127.htm
- DOI: https://dx.doi.org/10.4251/wjgo.v17.i9.109127