
















©The Author(s) 2025.
World J Gastrointest Oncol. Sep 15, 2025; 17(9): 109127
Published online Sep 15, 2025. doi: 10.4251/wjgo.v17.i9.109127
Published online Sep 15, 2025. doi: 10.4251/wjgo.v17.i9.109127
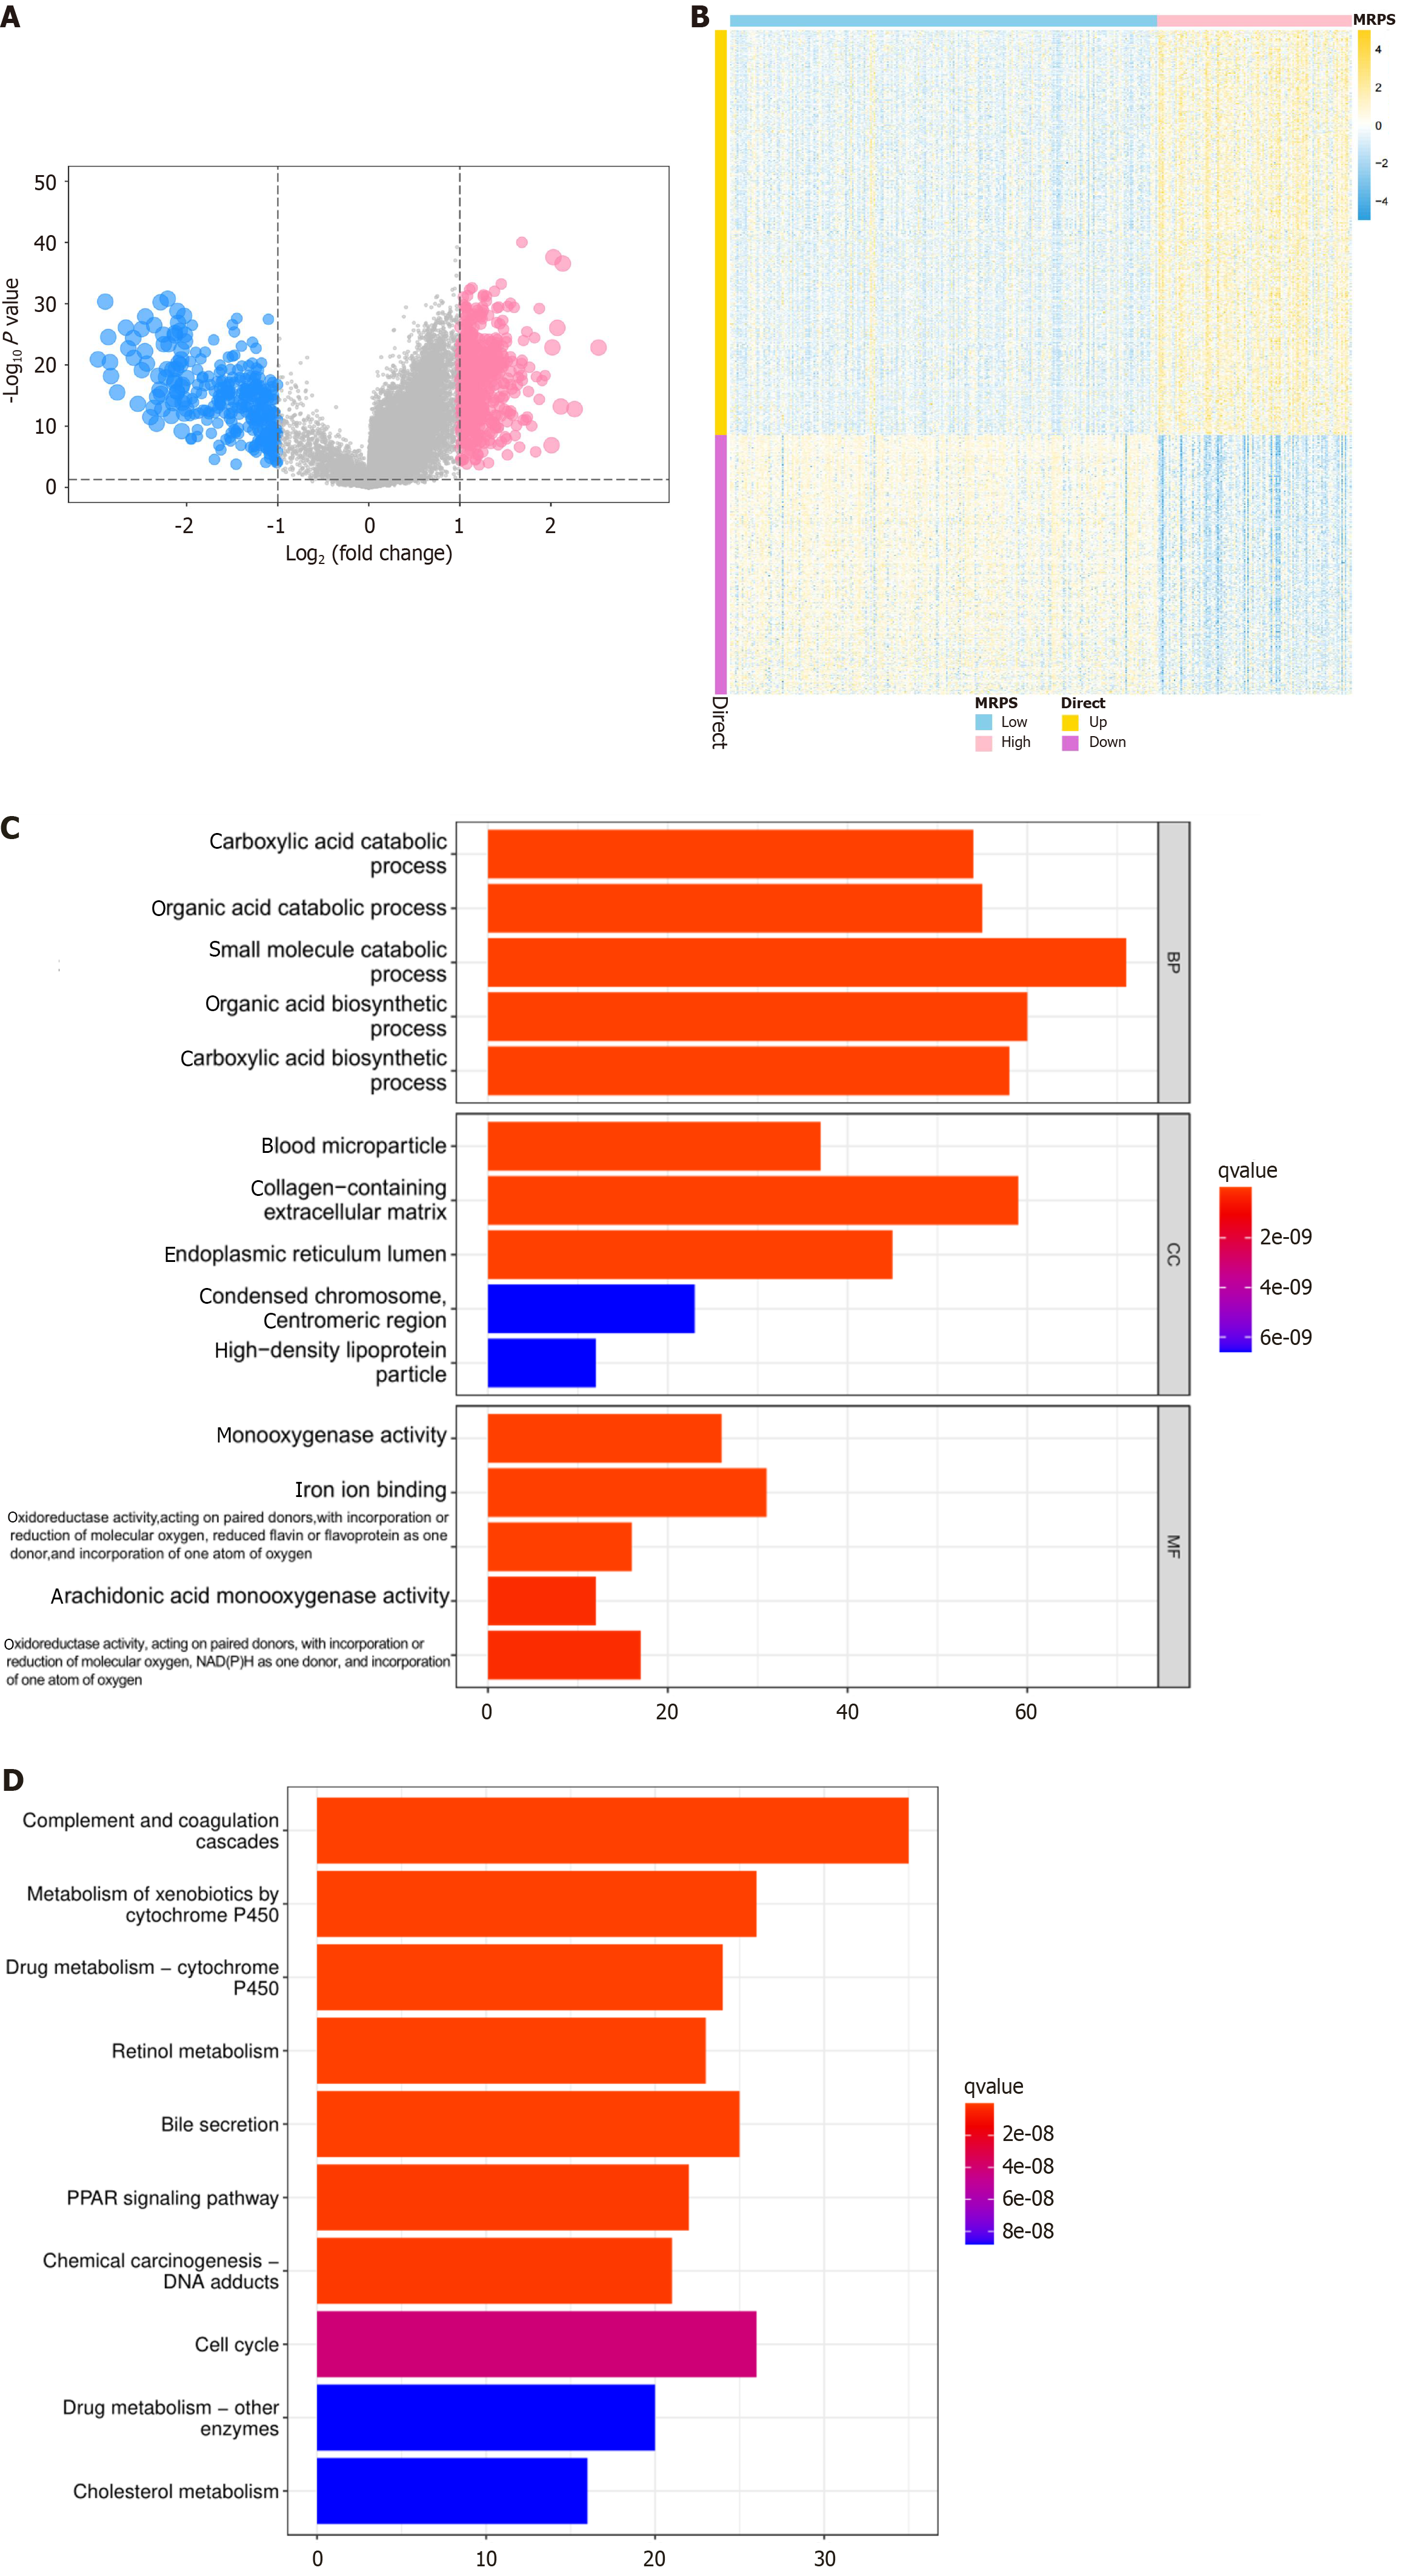
Figure 8 Identification of different MRPS groups differentially expressed genes and functional enrichment analysis.
A: Volcano plots showing 808 differentially expressed genes (DEGs) between different MRPS groups; B: Heatmap illustrating the expression patterns of the 808 DEGs between high and low MRPS patients; C: Gene Ontology enrichment analysis displaying the biological processes, cell components, and molecular functions associated with MARS1-related genes; D: Kyoto Encyclopedia of Genes and Genomes pathways analysis highlighting the pathways enriched in MARS1-related genes, including complement and coagulation cascades, cell cycle, xenobiotic metabolism by cytochrome P450, and bile secretion.
- Citation: Bu HY, Huang H, Li J, Huang ZB, Huang Y, Huang YK, Wang AM, Wu L, Yuan J, Wang RJ, Lu M, Yu SM, Yi PP, Chen YY, Jiang YP, Hu XW. Methionyl-tRNA synthetase 1 participates in hepatocellular carcinoma and its regulated gene profile possesses potent prognostic ability. World J Gastrointest Oncol 2025; 17(9): 109127
- URL: https://www.wjgnet.com/1948-5204/full/v17/i9/109127.htm
- DOI: https://dx.doi.org/10.4251/wjgo.v17.i9.109127