
















©The Author(s) 2025.
World J Gastrointest Oncol. Sep 15, 2025; 17(9): 109127
Published online Sep 15, 2025. doi: 10.4251/wjgo.v17.i9.109127
Published online Sep 15, 2025. doi: 10.4251/wjgo.v17.i9.109127
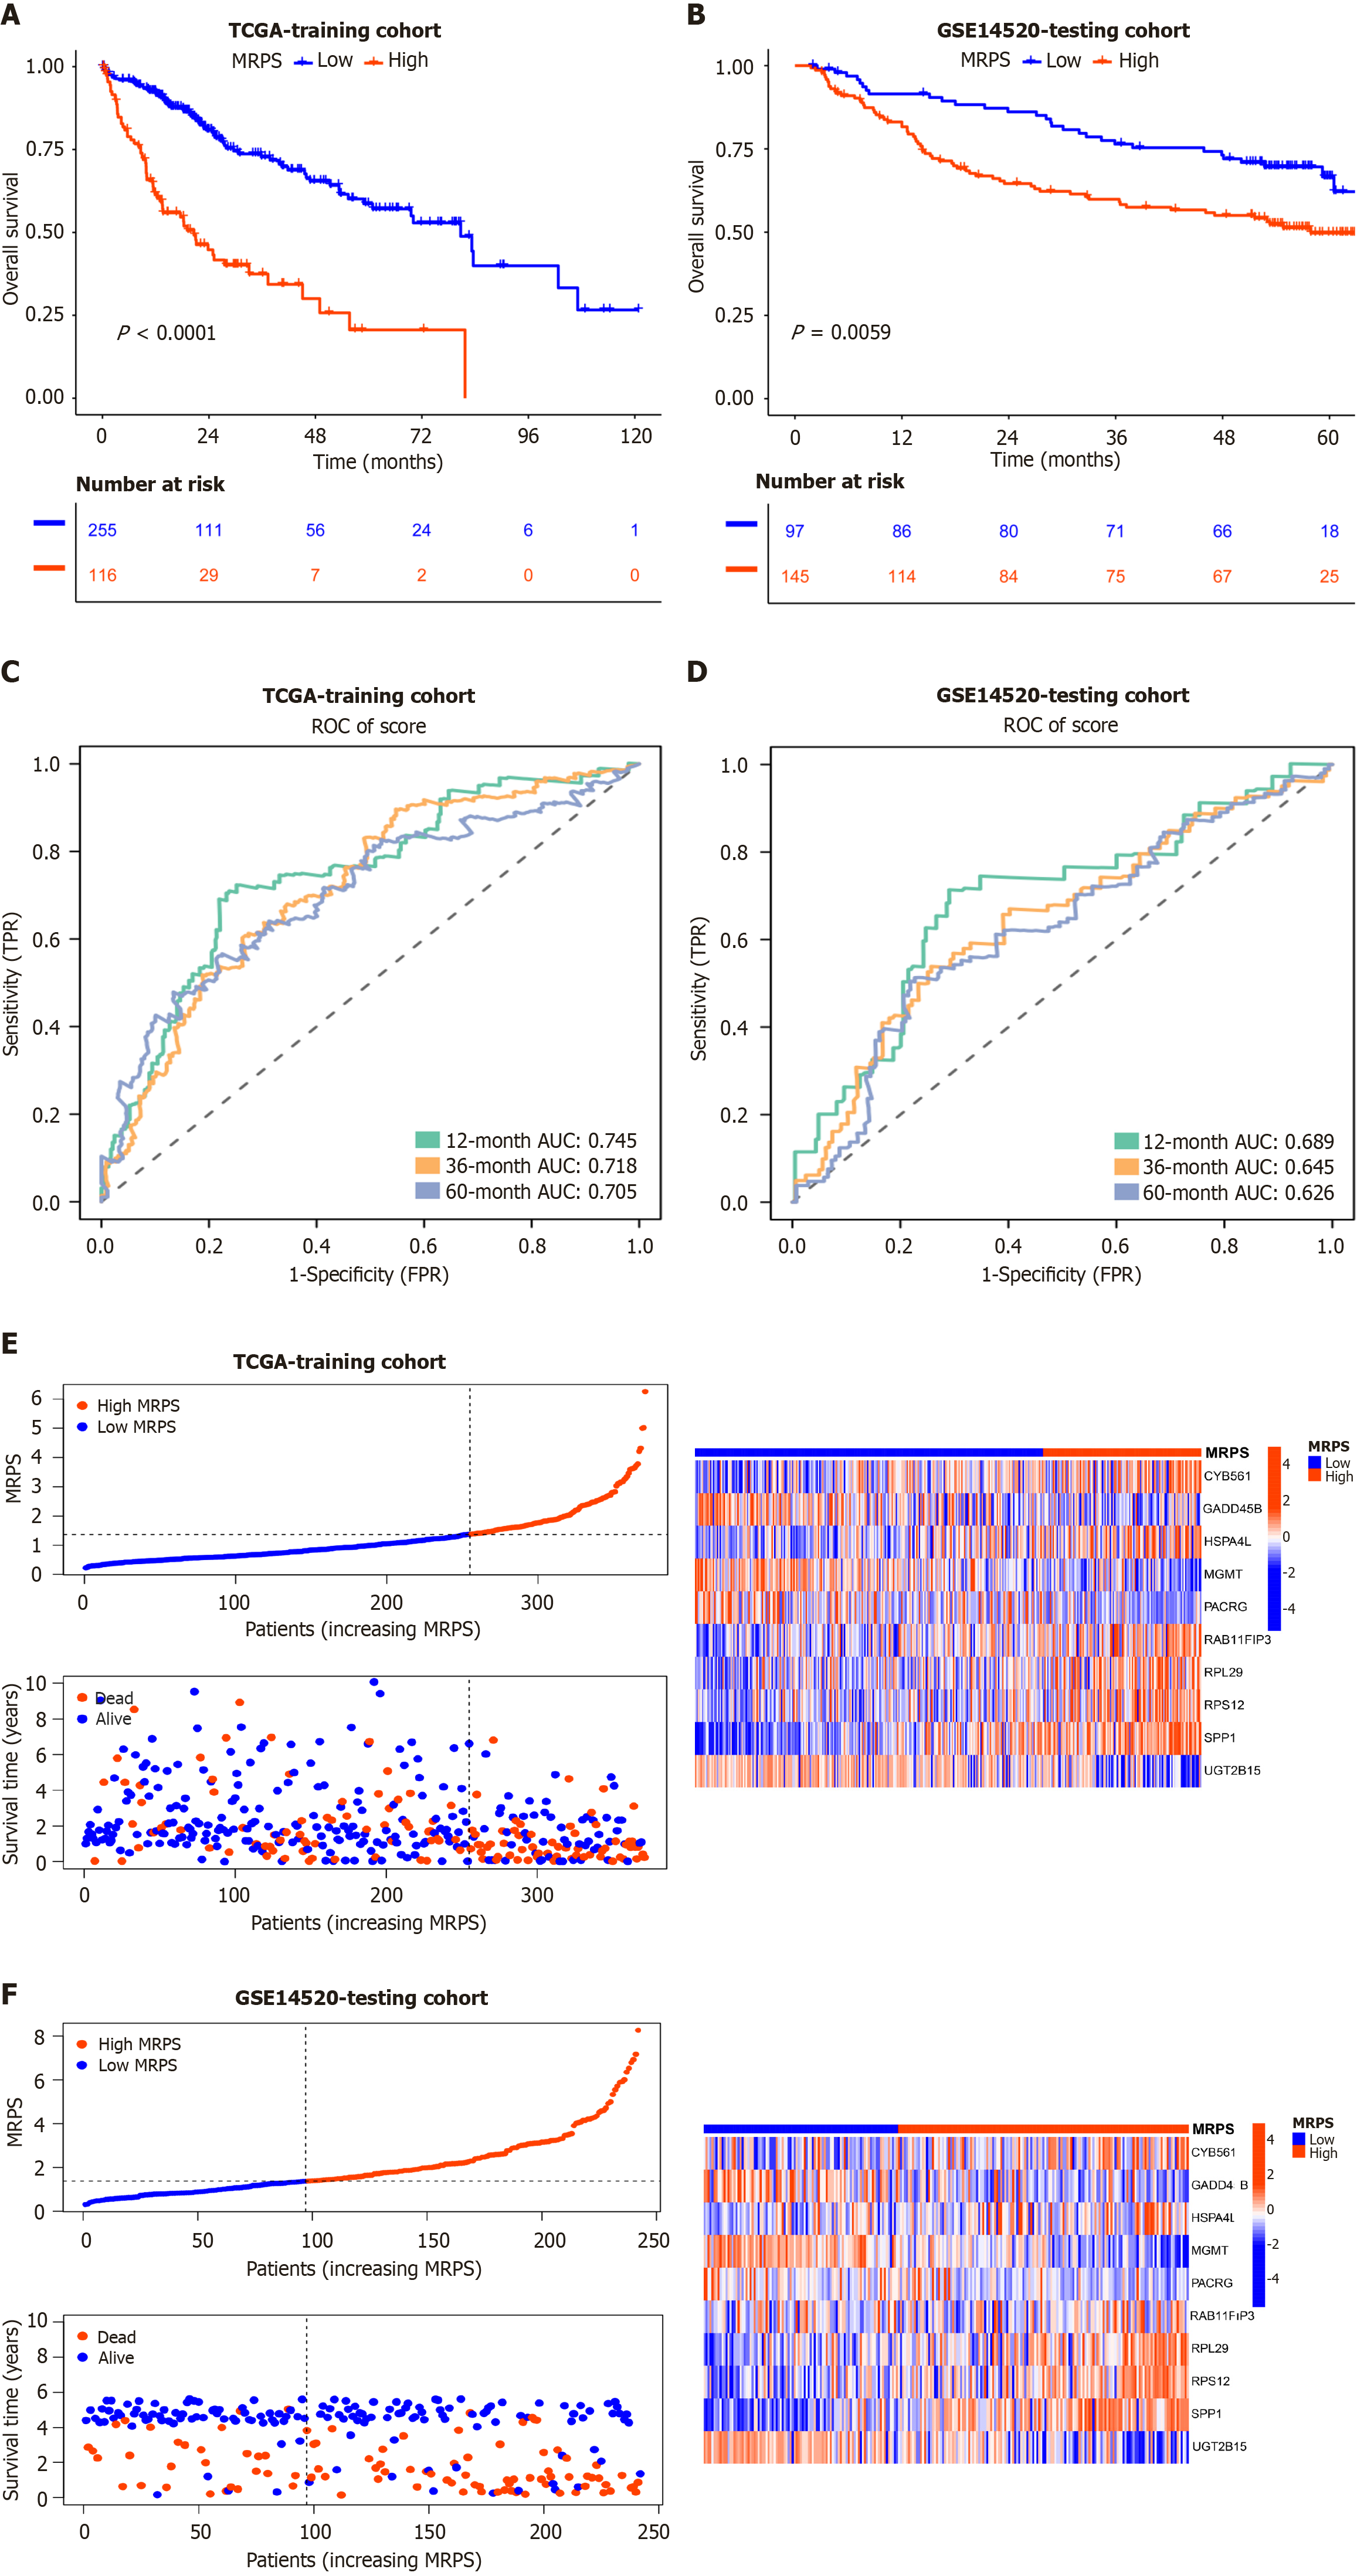
Figure 4 Evaluation and verification of MRPS in The Cancer Genome Atlas and GSE14520.
A and B: Kaplan–Meier curves illustrating the overall survival (OS) of patients classified into high and low MRPS groups in The Cancer Genome Atlas (TCGA)-hepatocellular carcinoma (HCC) (A) and GSE14520 (B); C and D: Receiver operating characteristic (ROC) curves showing the predictive performance of MRPS for 1-, 3-, and 5-year OS in the TCGA-HCC (C) and GSE14520 (D); E and F: Scatter plot of the risk score, OS, and corresponding heatmap based on MRPS in the TCGA (E) and GSE14520 (F). TCGA: The Cancer Genome Atlas; ROC: Receiver operating characteristic.
- Citation: Bu HY, Huang H, Li J, Huang ZB, Huang Y, Huang YK, Wang AM, Wu L, Yuan J, Wang RJ, Lu M, Yu SM, Yi PP, Chen YY, Jiang YP, Hu XW. Methionyl-tRNA synthetase 1 participates in hepatocellular carcinoma and its regulated gene profile possesses potent prognostic ability. World J Gastrointest Oncol 2025; 17(9): 109127
- URL: https://www.wjgnet.com/1948-5204/full/v17/i9/109127.htm
- DOI: https://dx.doi.org/10.4251/wjgo.v17.i9.109127