
















©The Author(s) 2025.
World J Gastrointest Oncol. Sep 15, 2025; 17(9): 109127
Published online Sep 15, 2025. doi: 10.4251/wjgo.v17.i9.109127
Published online Sep 15, 2025. doi: 10.4251/wjgo.v17.i9.109127
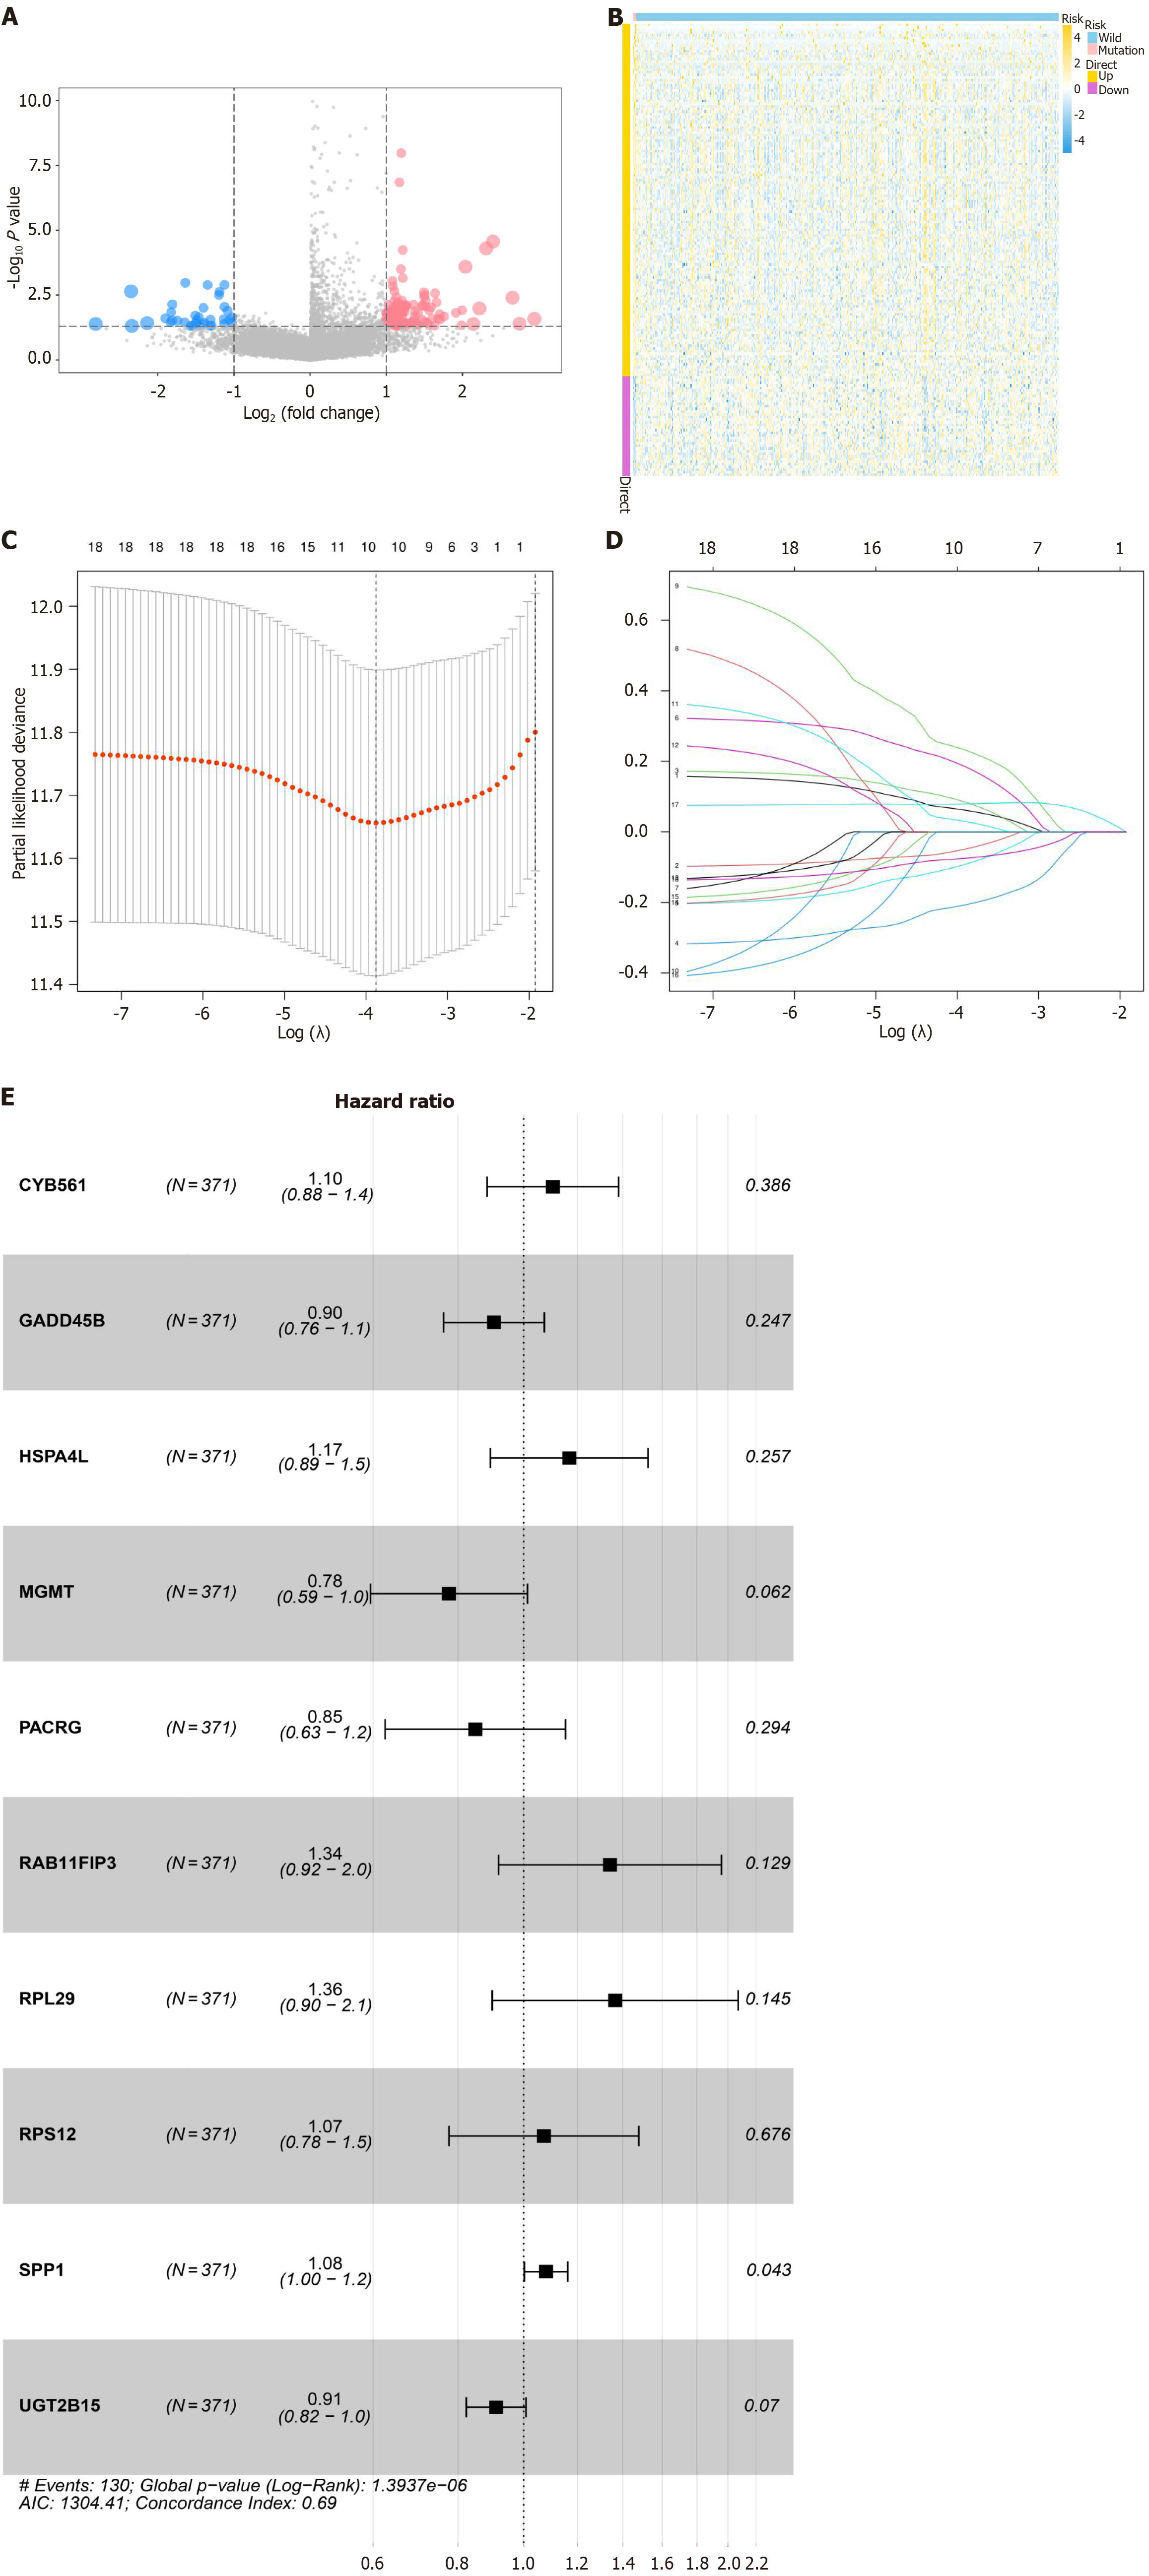
Figure 3 Visualization of differential MARS1-related genes.
A: Volcano plot showing differential expression of MARS1-related genes between MARS1-mutated and wild-type patients with hepatocarcinoma. Genes with significant differential expression are represented by dots; B: Heatmap illustrating the expression patterns of differential MARS1-related genes; C and D: LASSO regression analysis identifies the optimal lambda value associated with the 10 prognostic genes significantly linked to overall survival; E: Forest plot of multivariate Cox regression analysis for 10 genes, depicting hazard ratios and their 95% confidence intervals.
- Citation: Bu HY, Huang H, Li J, Huang ZB, Huang Y, Huang YK, Wang AM, Wu L, Yuan J, Wang RJ, Lu M, Yu SM, Yi PP, Chen YY, Jiang YP, Hu XW. Methionyl-tRNA synthetase 1 participates in hepatocellular carcinoma and its regulated gene profile possesses potent prognostic ability. World J Gastrointest Oncol 2025; 17(9): 109127
- URL: https://www.wjgnet.com/1948-5204/full/v17/i9/109127.htm
- DOI: https://dx.doi.org/10.4251/wjgo.v17.i9.109127