
















©The Author(s) 2025.
World J Gastrointest Oncol. Sep 15, 2025; 17(9): 108892
Published online Sep 15, 2025. doi: 10.4251/wjgo.v17.i9.108892
Published online Sep 15, 2025. doi: 10.4251/wjgo.v17.i9.108892
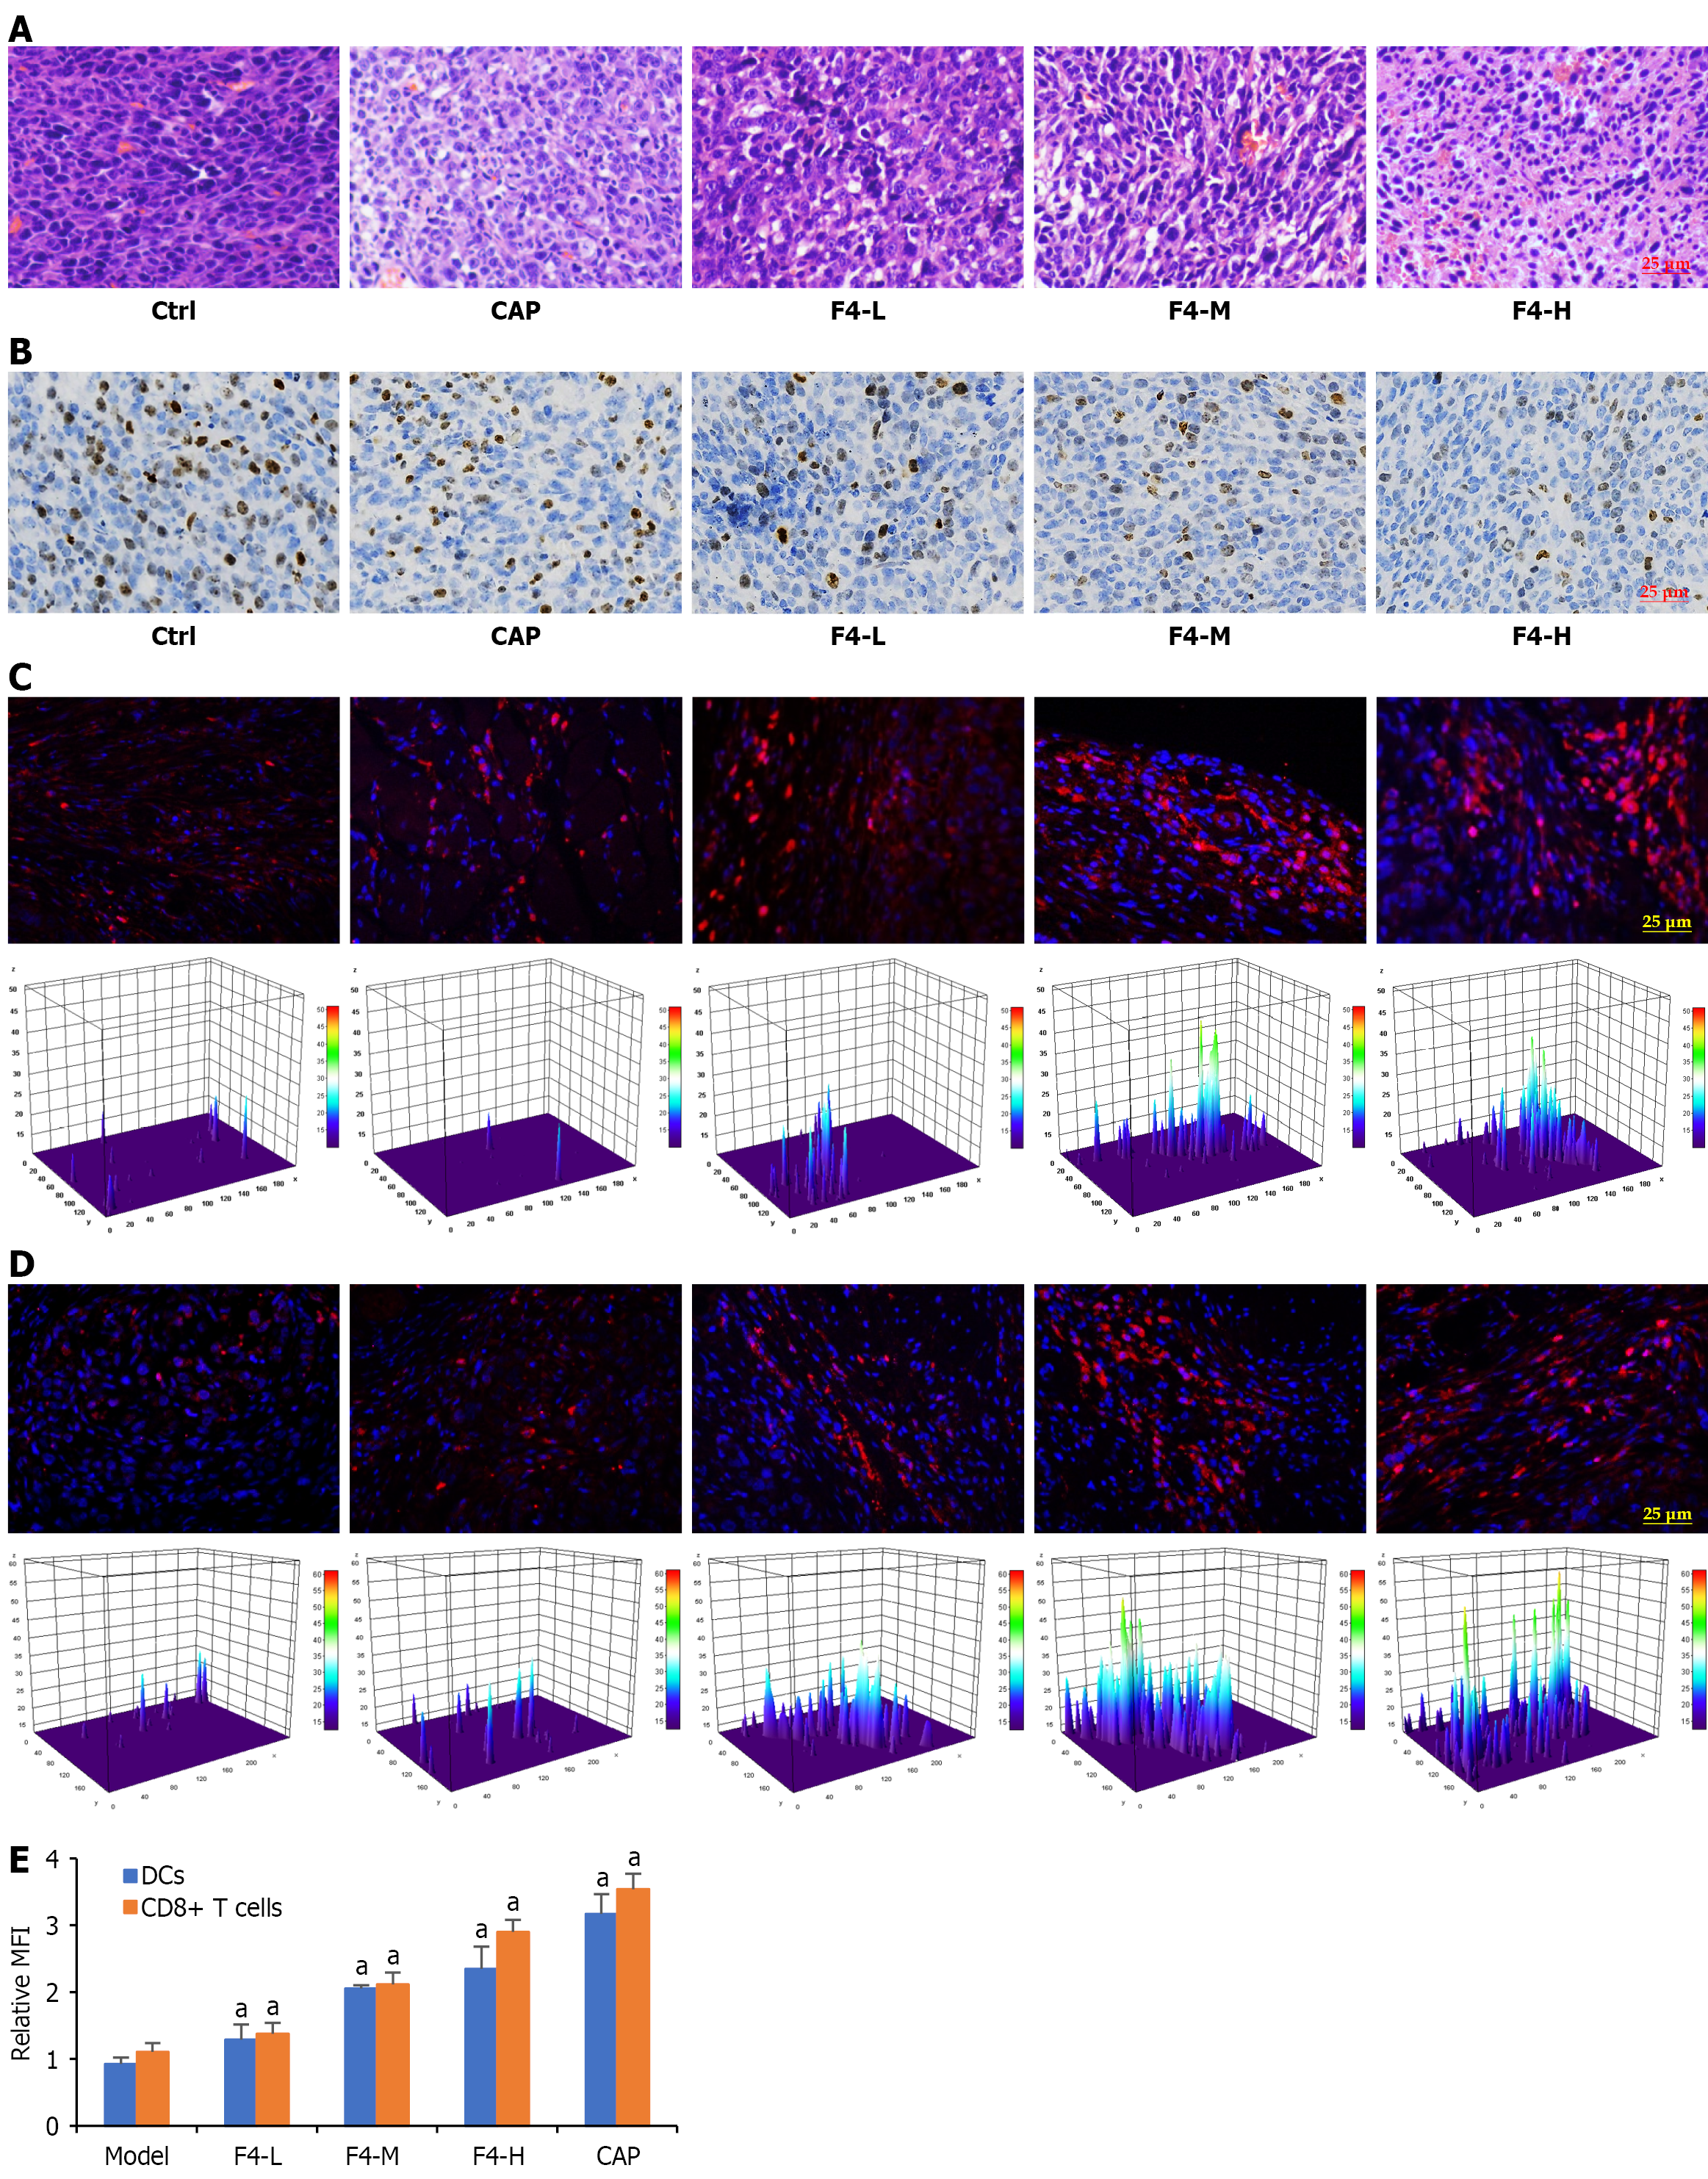
Figure 6 Effects of F4 on the immune cell infiltration in the tumor tissues of colon cancer CT26-bearing mice.
A: Histological change of tumor tissues; B: Representative immunohistochemical images of Ki67 protein expressions in the tumor tissue; C: Representative immunofluorescent images indicated the infiltration of dendritic cells (DCs); D: Cluster of differentiation (CD) 8+ T cells in the tumor tissues. DCs were stained with Texas red-labeled CD11c antibody (red), CD8+ T cells were stained with Texas red-labeled CD8 antibody (red), and nuclei was stained with 4’,6-diamidino-2-phenylindole (blue); E: Quantification of DC or CD8+ T-cell infiltration was visualized by using three-dimensional Gaussian density analysis. All data were shown as mean ± SD (n = 5). aP < 0.05. P vs model group. Ctrl: Control; CAP: Capecitabine; L: Low; M: Middle; H: High; DC: Dendritic cells; CD: Cluster of differentiation; MFI: Mean fluorescence intensity.
- Citation: Xie W, Li XJ, Zhong YS, Fang J, Qi H, Yang M, Ying HZ, Yu CH. Ginsenoside F4 inhibits colorectal cancer progression by boosting dendritic cell maturation and remodeling the tumor microenvironment. World J Gastrointest Oncol 2025; 17(9): 108892
- URL: https://www.wjgnet.com/1948-5204/full/v17/i9/108892.htm
- DOI: https://dx.doi.org/10.4251/wjgo.v17.i9.108892