
















©The Author(s) 2025.
World J Gastrointest Oncol. Sep 15, 2025; 17(9): 108892
Published online Sep 15, 2025. doi: 10.4251/wjgo.v17.i9.108892
Published online Sep 15, 2025. doi: 10.4251/wjgo.v17.i9.108892
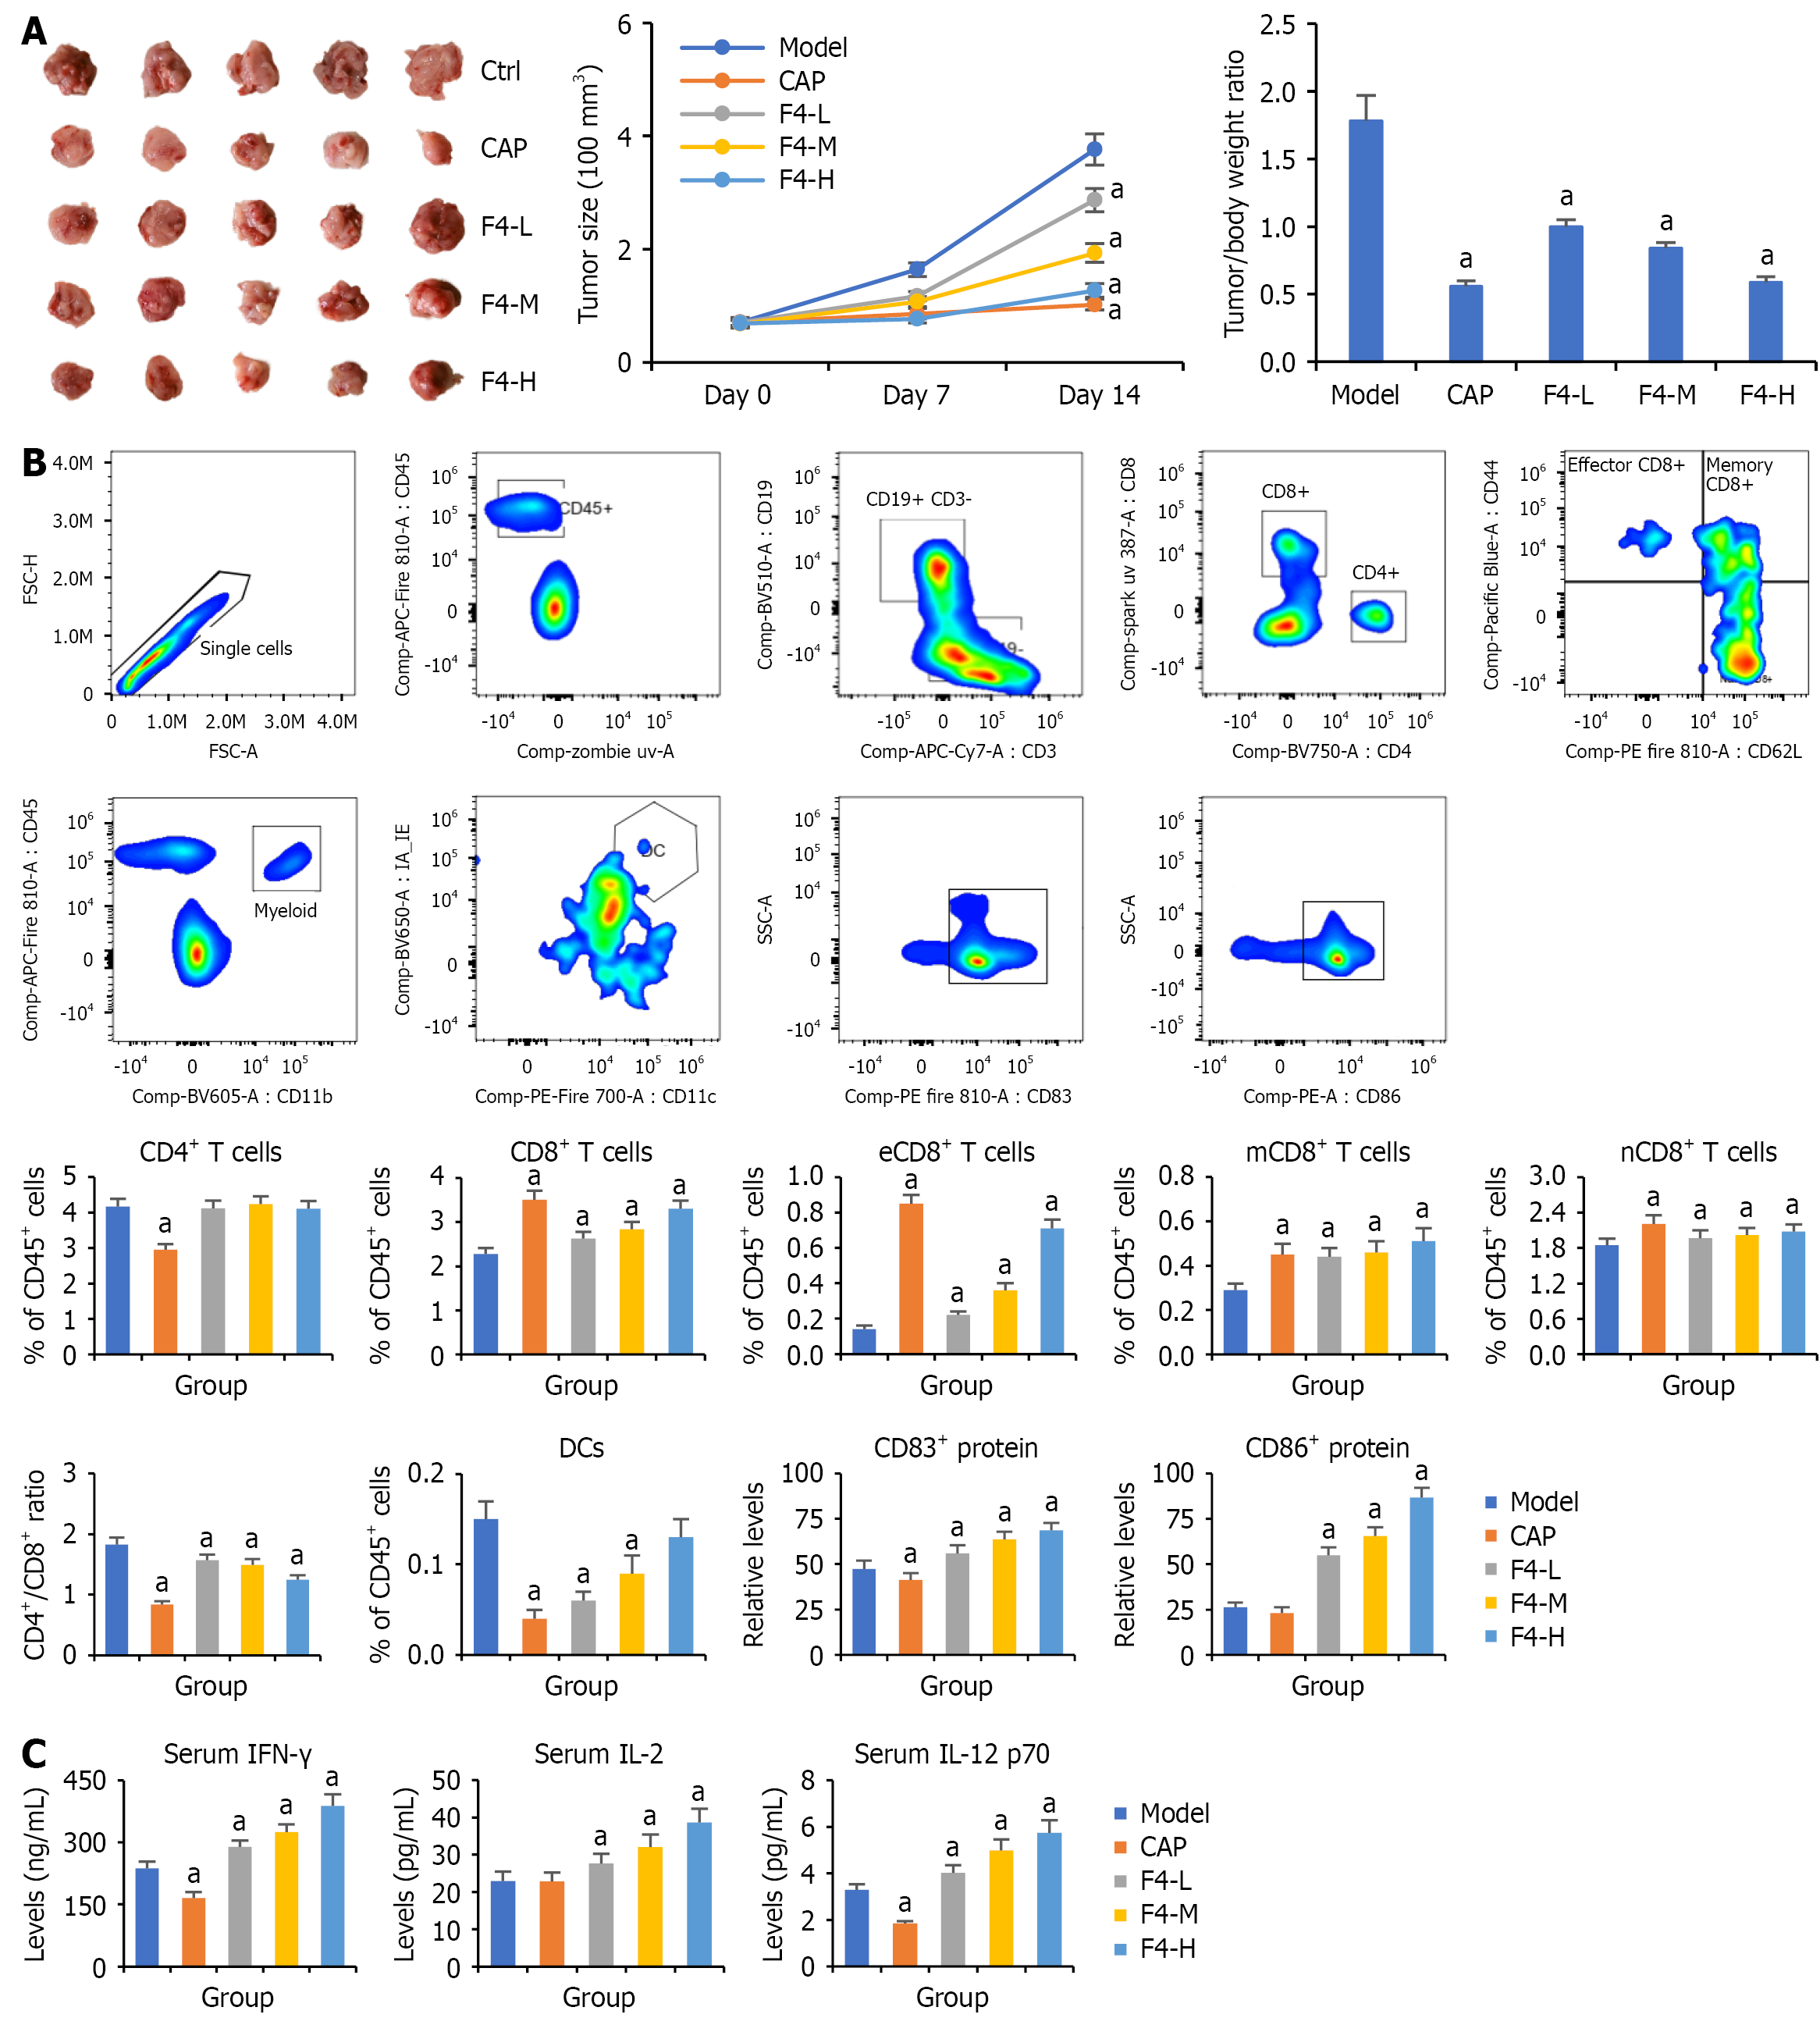
Figure 5 Effects of F4 on the tumor growth of CT26-bearing mice.
A: Inhibition of F4 on the tumor size and tumor/body weight ratio in CT26-bearing mice; B: The landscapes of peripheral immune cells detected by using 15-color spectral flow cytometry; C: The levels of interferon-γ, interleukin-2, and interleukin-12 p70 in the serum detected by enzyme-linked immunosorbent assay. All data were shown as mean ± SD (n = 5). aP < 0.05. P vs model group. Ctrl: Control; CAP: Capecitabine; L: Low; M: Middle; H: High; CD: Cluster of differentiation; eCD: Effective cluster of differentiation; mCD: Memory cluster of differentiation; nCD: Native cluster of differentiation; FSC-H: Forward scatter height; FSC-A: Forward scatter area; APC: Allophycocyanin; BV: Brilliant violet; UV: Ultraviolet; PE: Phycoerythrin; SSC-A: Side scatter area; PE-A: Phycoerythrin area; DC: Dendritic cells; IFN: Interferon; IL: Interleukin.
- Citation: Xie W, Li XJ, Zhong YS, Fang J, Qi H, Yang M, Ying HZ, Yu CH. Ginsenoside F4 inhibits colorectal cancer progression by boosting dendritic cell maturation and remodeling the tumor microenvironment. World J Gastrointest Oncol 2025; 17(9): 108892
- URL: https://www.wjgnet.com/1948-5204/full/v17/i9/108892.htm
- DOI: https://dx.doi.org/10.4251/wjgo.v17.i9.108892