
















©The Author(s) 2025.
World J Gastrointest Oncol. Sep 15, 2025; 17(9): 108672
Published online Sep 15, 2025. doi: 10.4251/wjgo.v17.i9.108672
Published online Sep 15, 2025. doi: 10.4251/wjgo.v17.i9.108672
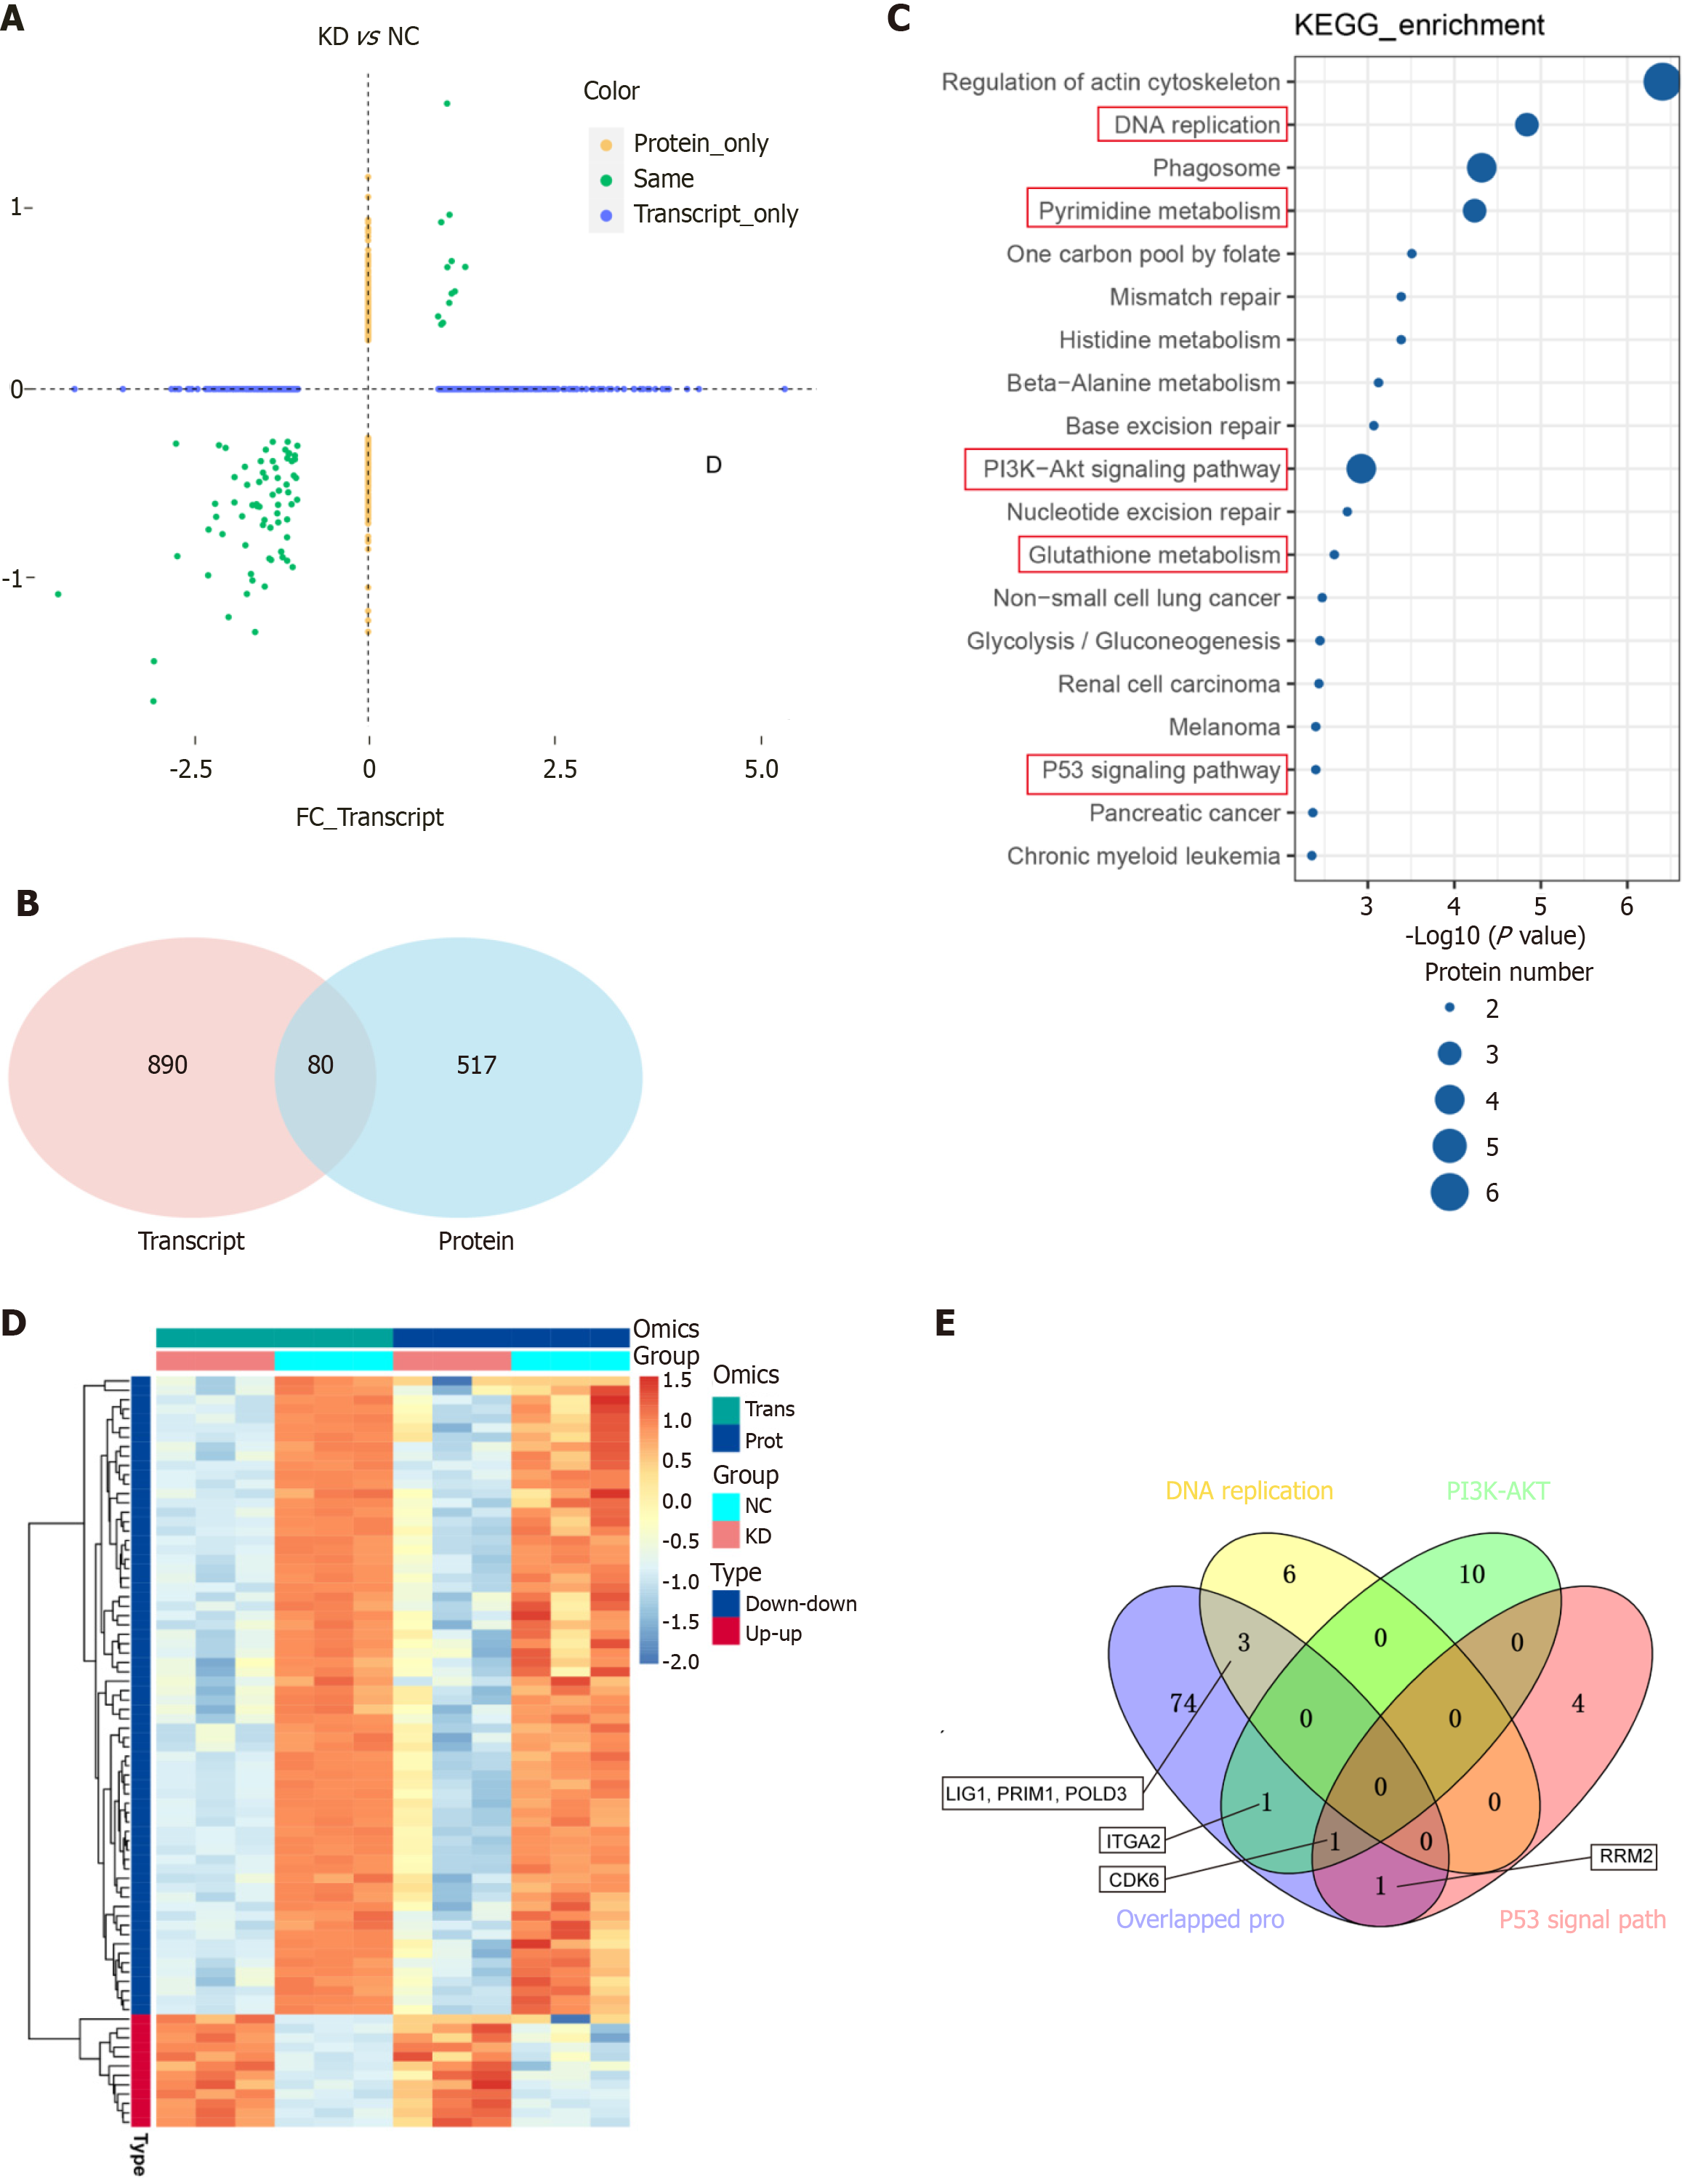
Figure 7 Proteomic (|log2FoldChange| > 1.
2 P ≤ 0.05) and RNA-seq |log2FoldChange|≥ 1.0, Padj ≤ 0.05 expression correlation analysis by DEAD/H-box RNA helicase 10 knockdown (shRNA) and control (NC). A: Proteomic and RNA-seq expression correlation analysis plots; B-E: The results of the association analysis were categorized into the following four categories: Demonstrating the distribution of overlap between proteomes and transcriptomes using the Venn plot (B); Heatmap for hierarchical clustering using differential proteins and associated transcriptomic data (C); The most significantly enriched pathways among the 80 genes were selected to be shown in bubble plots (D); The overlapping of 80 genes with PI3K-AKT, P53 signal pathway and DNA replication to produce a Venn diagram (E).
- Citation: Qiu ZS, Wang XC, Ma JC, Zhu CL, Hu YL, Da MX. DEAD/H-box RNA helicase 10 promotes pancreatic cancer cell proliferation via ribonucleotide reductase M2. World J Gastrointest Oncol 2025; 17(9): 108672
- URL: https://www.wjgnet.com/1948-5204/full/v17/i9/108672.htm
- DOI: https://dx.doi.org/10.4251/wjgo.v17.i9.108672