
















©The Author(s) 2025.
World J Gastrointest Oncol. Sep 15, 2025; 17(9): 108672
Published online Sep 15, 2025. doi: 10.4251/wjgo.v17.i9.108672
Published online Sep 15, 2025. doi: 10.4251/wjgo.v17.i9.108672
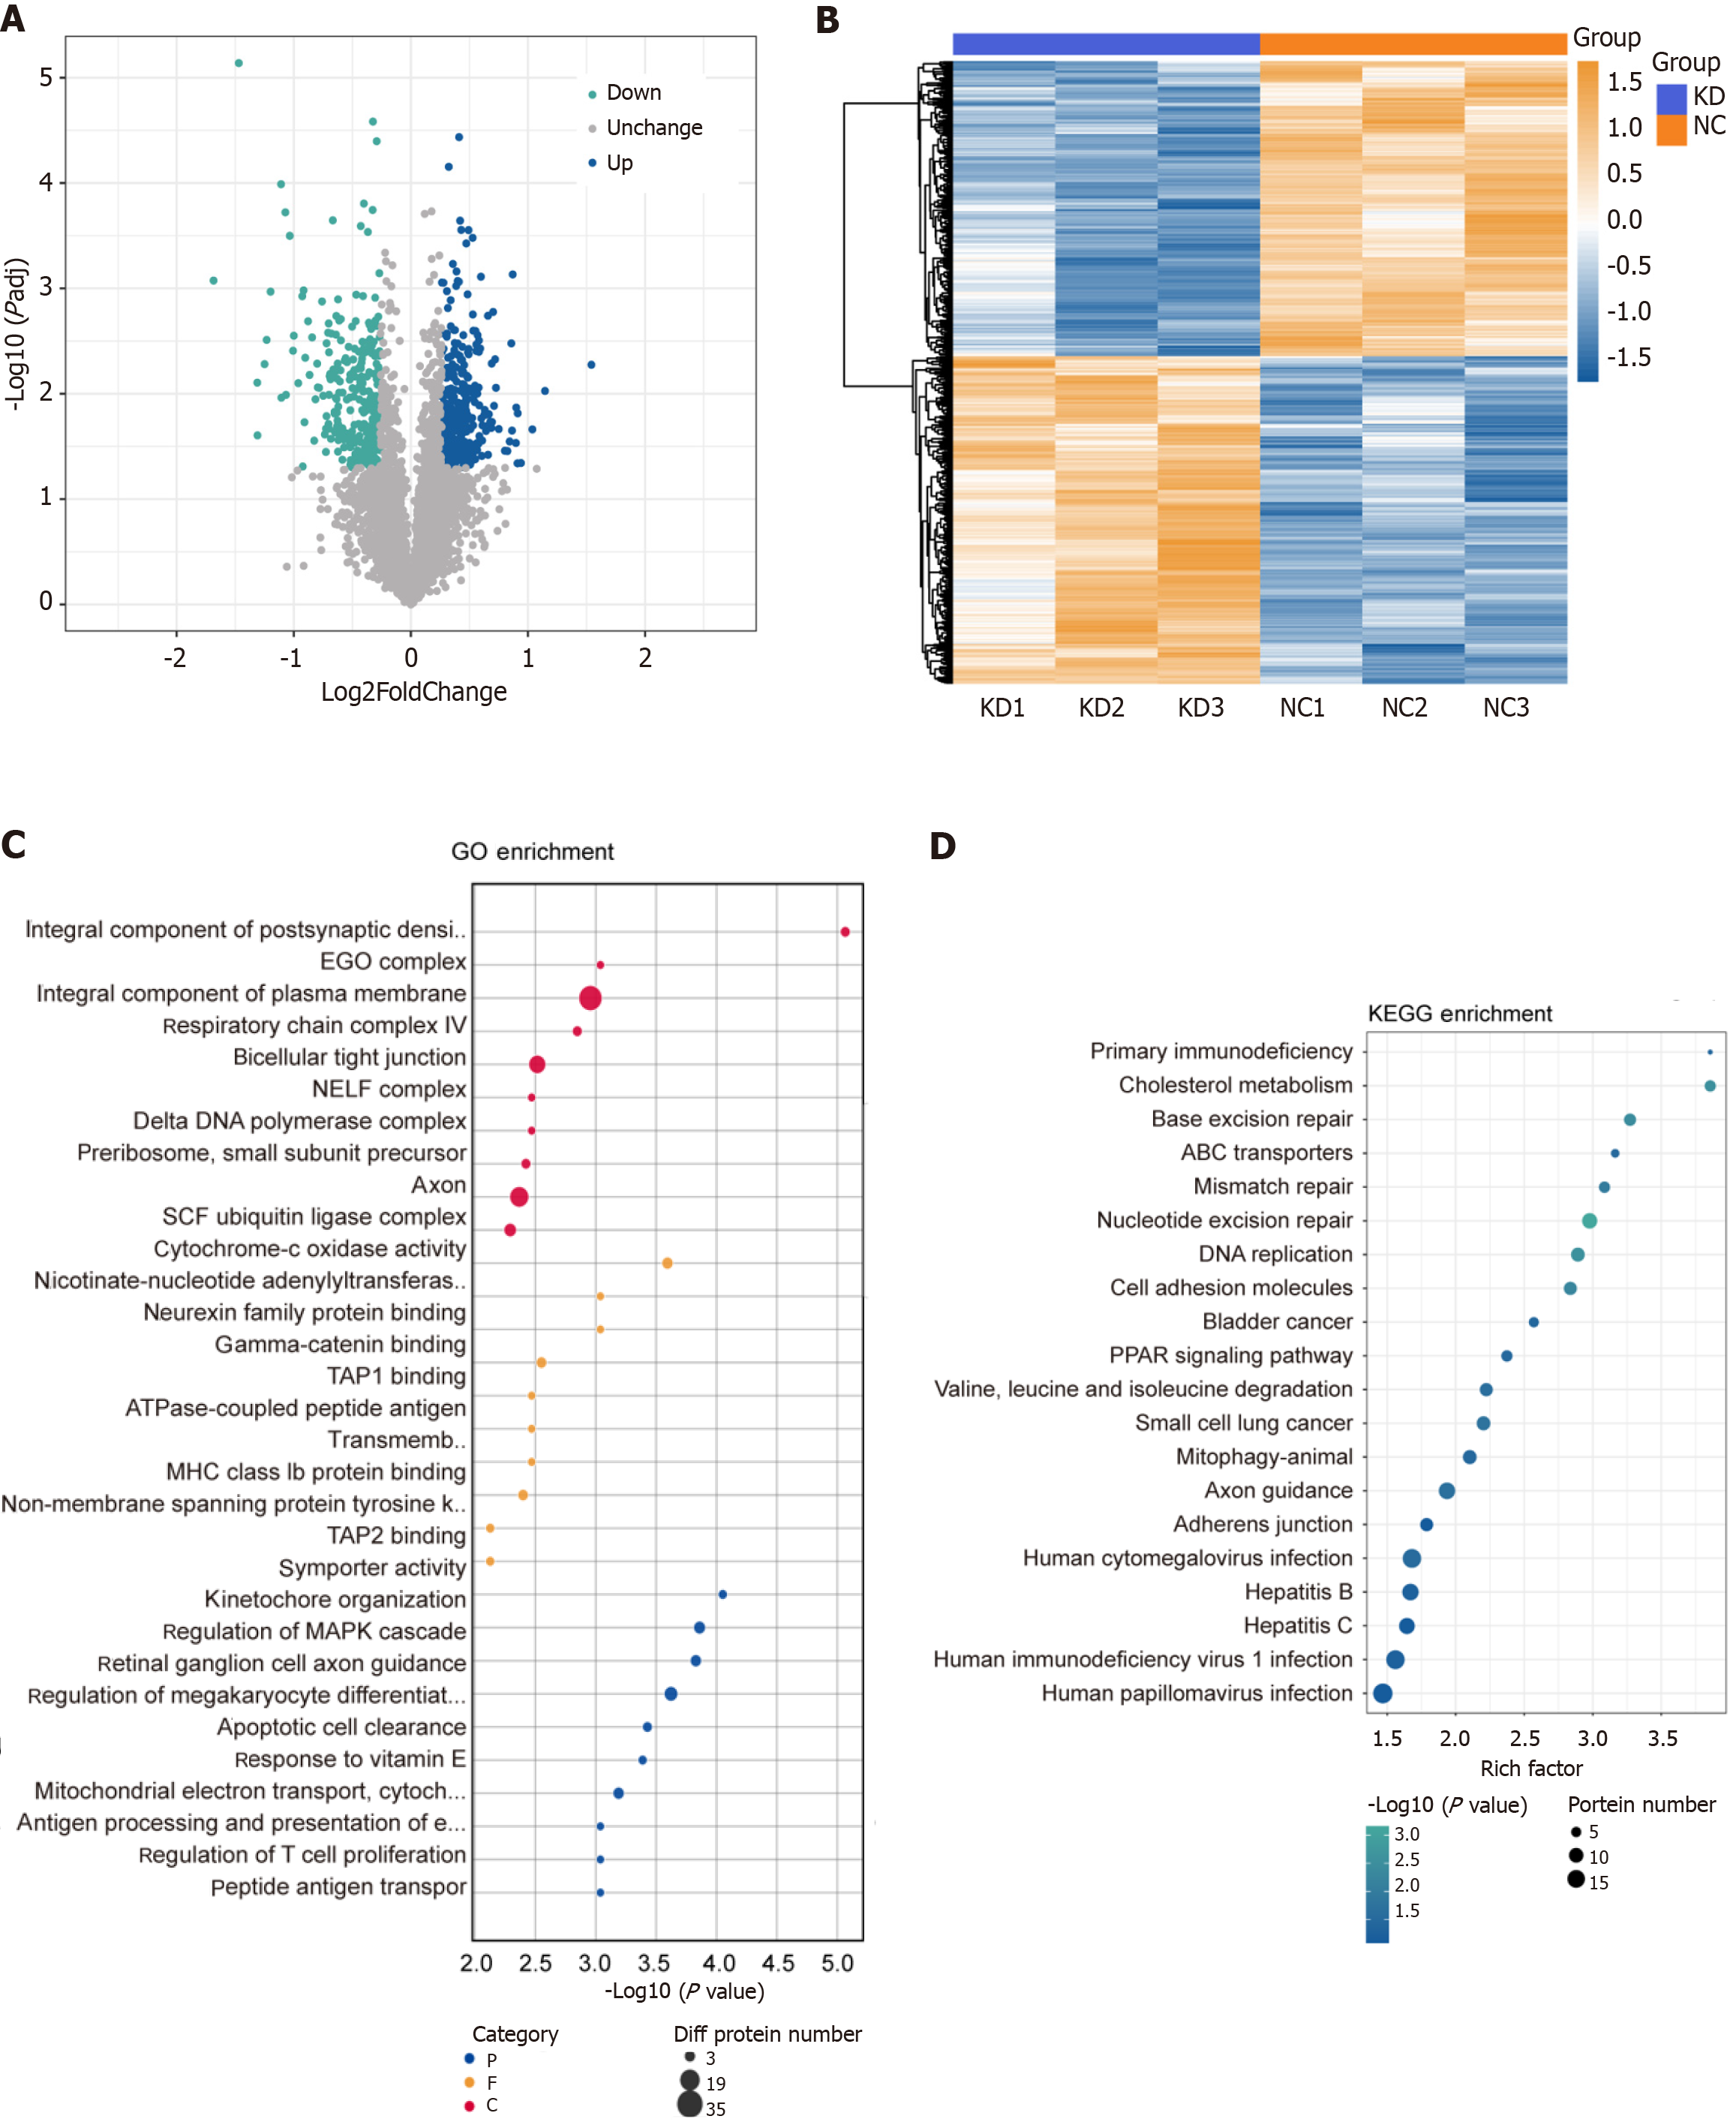
Figure 6 Proteomics analysis by DEAD/H-box RNA helicase 10 knockdown (shRNA) and control (NC).
|log2FoldChange| > 1.2 P ≤ 0.05. A: Differential proteins Volcano Map; B: The quantitative values of target proteins were normalized. Then used the matplotlib package in Python to classify samples and protein expression at the same time (distance algorithm: Euclidean; connection method: Average linkage). Finally, the hierarchical clustering heat map was generated; C and D: Based on the Fisher's Exact Test, compared the distribution of each GO term or KEGG pathway in the target protein set and the total protein set. Then, evaluate the significance level of the enrichment of a GO term or KEGG pathway.to be shown in bubble plots.
- Citation: Qiu ZS, Wang XC, Ma JC, Zhu CL, Hu YL, Da MX. DEAD/H-box RNA helicase 10 promotes pancreatic cancer cell proliferation via ribonucleotide reductase M2. World J Gastrointest Oncol 2025; 17(9): 108672
- URL: https://www.wjgnet.com/1948-5204/full/v17/i9/108672.htm
- DOI: https://dx.doi.org/10.4251/wjgo.v17.i9.108672