















©The Author(s) 2025.
World J Gastrointest Oncol. Sep 15, 2025; 17(9): 107651
Published online Sep 15, 2025. doi: 10.4251/wjgo.v17.i9.107651
Published online Sep 15, 2025. doi: 10.4251/wjgo.v17.i9.107651
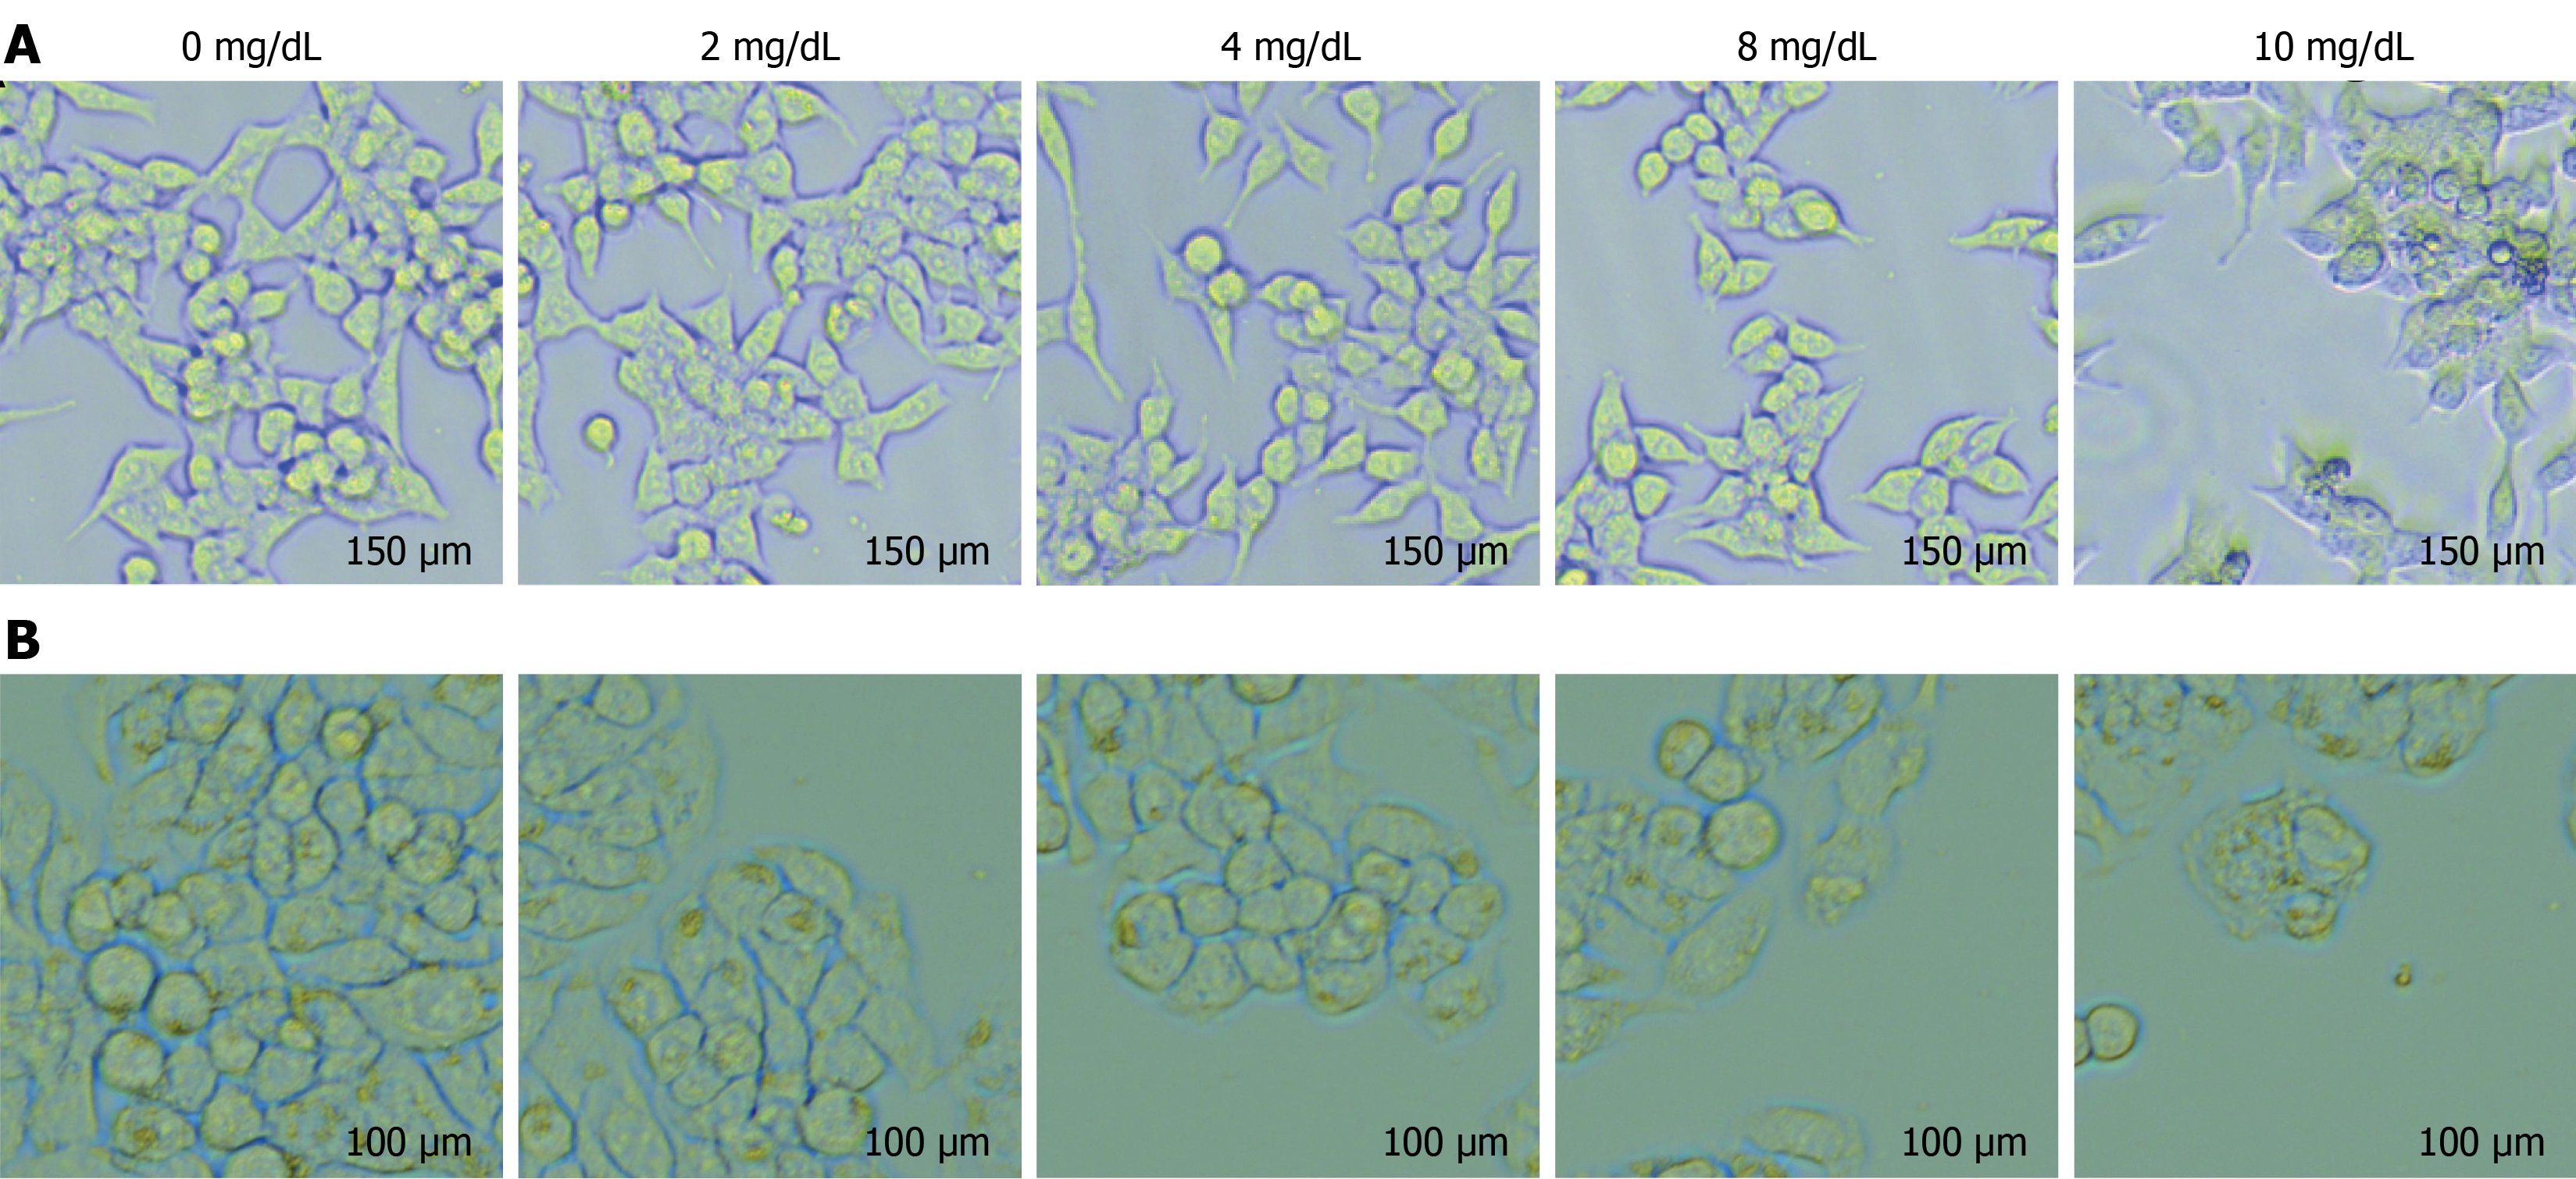
Figure 2 Cell morphology of colon cells after intervention with different concentrations of uric acid.
A: Cell morphology of HCT-116 cells after intervention with different concentrations of uric acid; B: Cell morphology of HT29 cells after intervention with different concentrations of uric acid.
- Citation: Sun TF, Fan KX, Luo YX, Song J, Han ZX, Zhang XL. Relationship between uric acid and colon cancer risk: Dose-response analysis and mechanisms. World J Gastrointest Oncol 2025; 17(9): 107651
- URL: https://www.wjgnet.com/1948-5204/full/v17/i9/107651.htm
- DOI: https://dx.doi.org/10.4251/wjgo.v17.i9.107651