Copyright
©The Author(s) 2025.
World J Gastrointest Oncol. Jul 15, 2025; 17(7): 107589
Published online Jul 15, 2025. doi: 10.4251/wjgo.v17.i7.107589
Published online Jul 15, 2025. doi: 10.4251/wjgo.v17.i7.107589
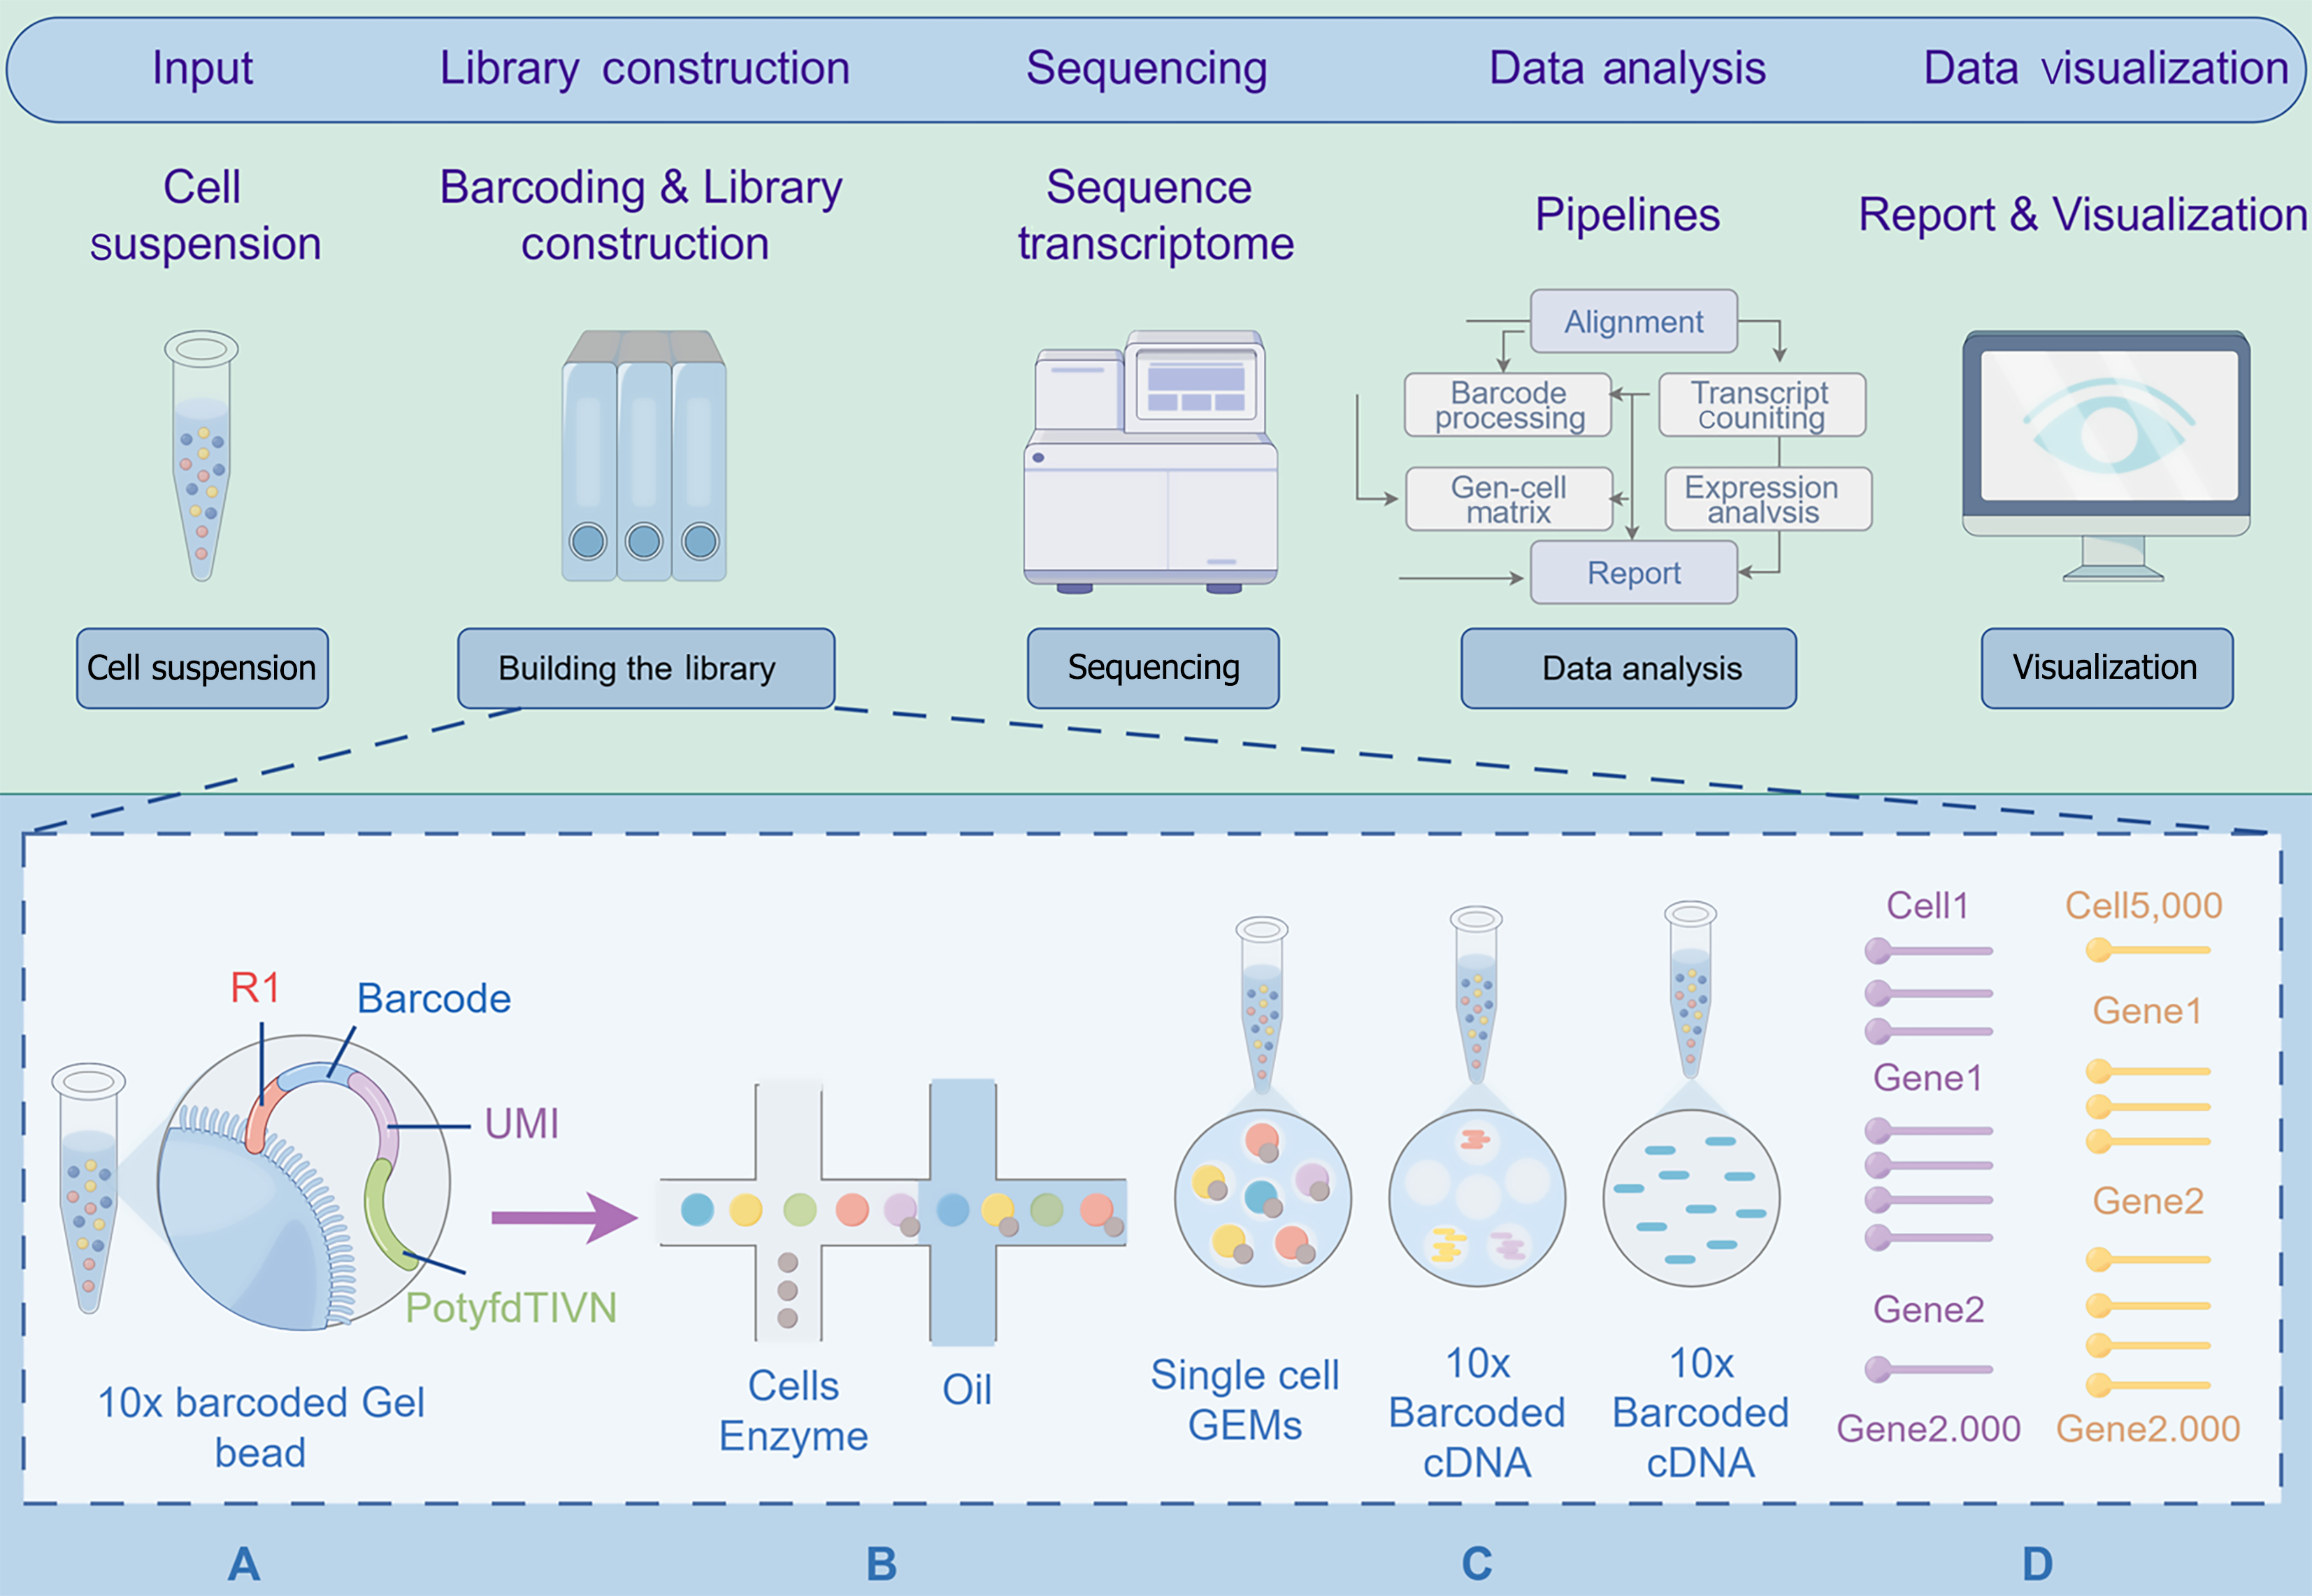
Figure 2 The workflow diagram of single cell RNA sequencing.
Starting with cell suspension as the input, in library construction, 10 × barcoded gel beads with barcode and unique molecular identifier sequences are used, mixed with cells, enzymes, and oil to form single cell gel bead-in-emulsion and generate 10 × Barcoded complementary DNA. Then, the transcriptome is sequenced. Subsequently, in data analysis, bioinformatics pipelines like alignment, barcode processing, etc., are employed to generate a report. Finally, in data visualization, the analyzed data is presented graphically via computer software for easier interpretation of biological meaning. UMI: Unique molecular identifier; cDNA: Complementary DNA; GEMs: Gel bead-in-emulsion.
- Citation: Xu ZX, Qu FY, Zhang Z, Luan WY, Lin SX, Miao YD. Exploring the role of neutrophil extracellular traps in colorectal cancer: Insights from single-cell sequencing. World J Gastrointest Oncol 2025; 17(7): 107589
- URL: https://www.wjgnet.com/1948-5204/full/v17/i7/107589.htm
- DOI: https://dx.doi.org/10.4251/wjgo.v17.i7.107589


