Copyright
©The Author(s) 2025.
World J Gastrointest Oncol. Jul 15, 2025; 17(7): 105981
Published online Jul 15, 2025. doi: 10.4251/wjgo.v17.i7.105981
Published online Jul 15, 2025. doi: 10.4251/wjgo.v17.i7.105981
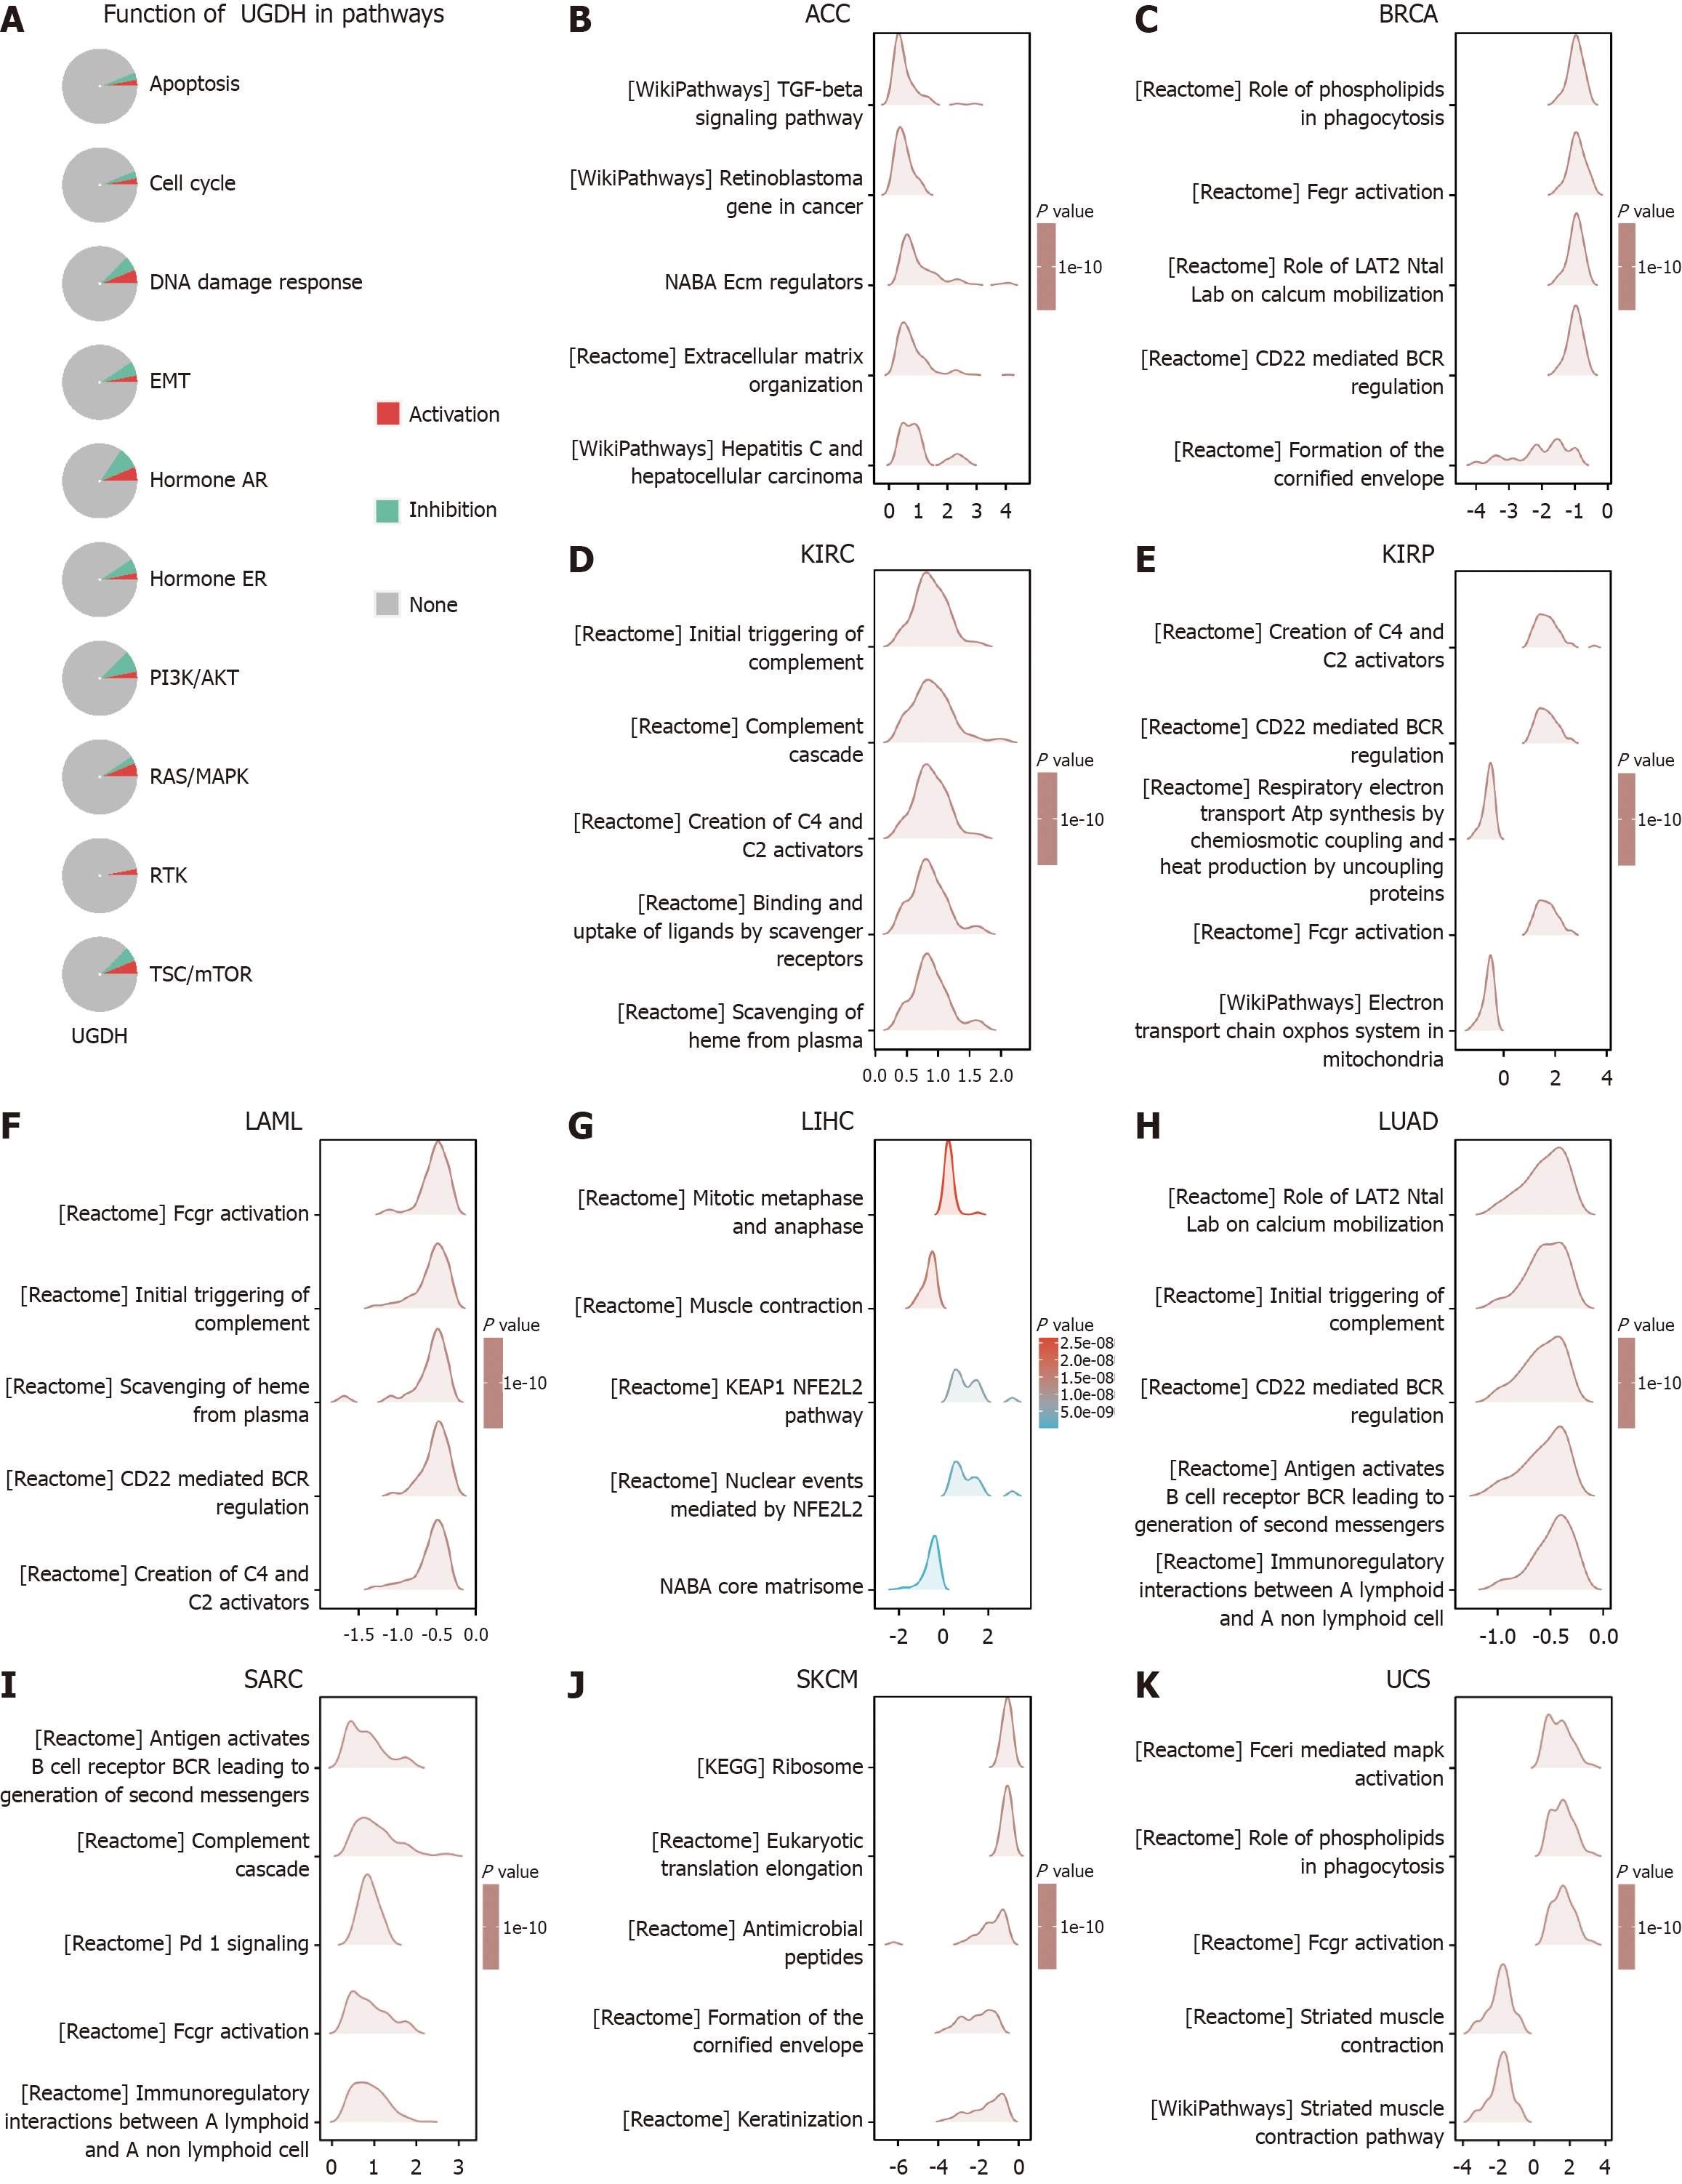
Figure 8 GSEA functional enrichment analysis of UDP-glucose 6-dehydrogenase expression in ten cancers.
A: UGDH function in pathways with activation or inhibition; B: GSEA analysis of UGDH in ACC; C: GSEA analysis of UGDH in BRCA; D: GSEA analysis of UGDH in KIRC; E: GSEA analysis of UGDH in KIRP; F: GSEA analysis of UGDH in LAML; G: GSEA analysis of UGDH in LIHC; H: GSEA analysis of UGDH in LUAD; I: GSEA analysis of UGDH in SARC; J: GSEA analysis of UGDH in SKCM; K: GSEA analysis of UGDH in UCS. The Y-axis represents one gene set, and the X-axis represents the distribution of log (FC) values corresponding to the core molecules in each gene set.
- Citation: Cao X, Zheng SH, Shen JM, Li SZ, Hou L, Zhang JX, Li XK, Du HB, Zhang LP, Ye YA, Zao XB. Pan-cancer analysis of UDP-glucose 6-dehydrogenase in human tumors and its function in hepatocellular carcinoma. World J Gastrointest Oncol 2025; 17(7): 105981
- URL: https://www.wjgnet.com/1948-5204/full/v17/i7/105981.htm
- DOI: https://dx.doi.org/10.4251/wjgo.v17.i7.105981


