
















©The Author(s) 2025.
World J Gastrointest Oncol. Jul 15, 2025; 17(7): 105264
Published online Jul 15, 2025. doi: 10.4251/wjgo.v17.i7.105264
Published online Jul 15, 2025. doi: 10.4251/wjgo.v17.i7.105264
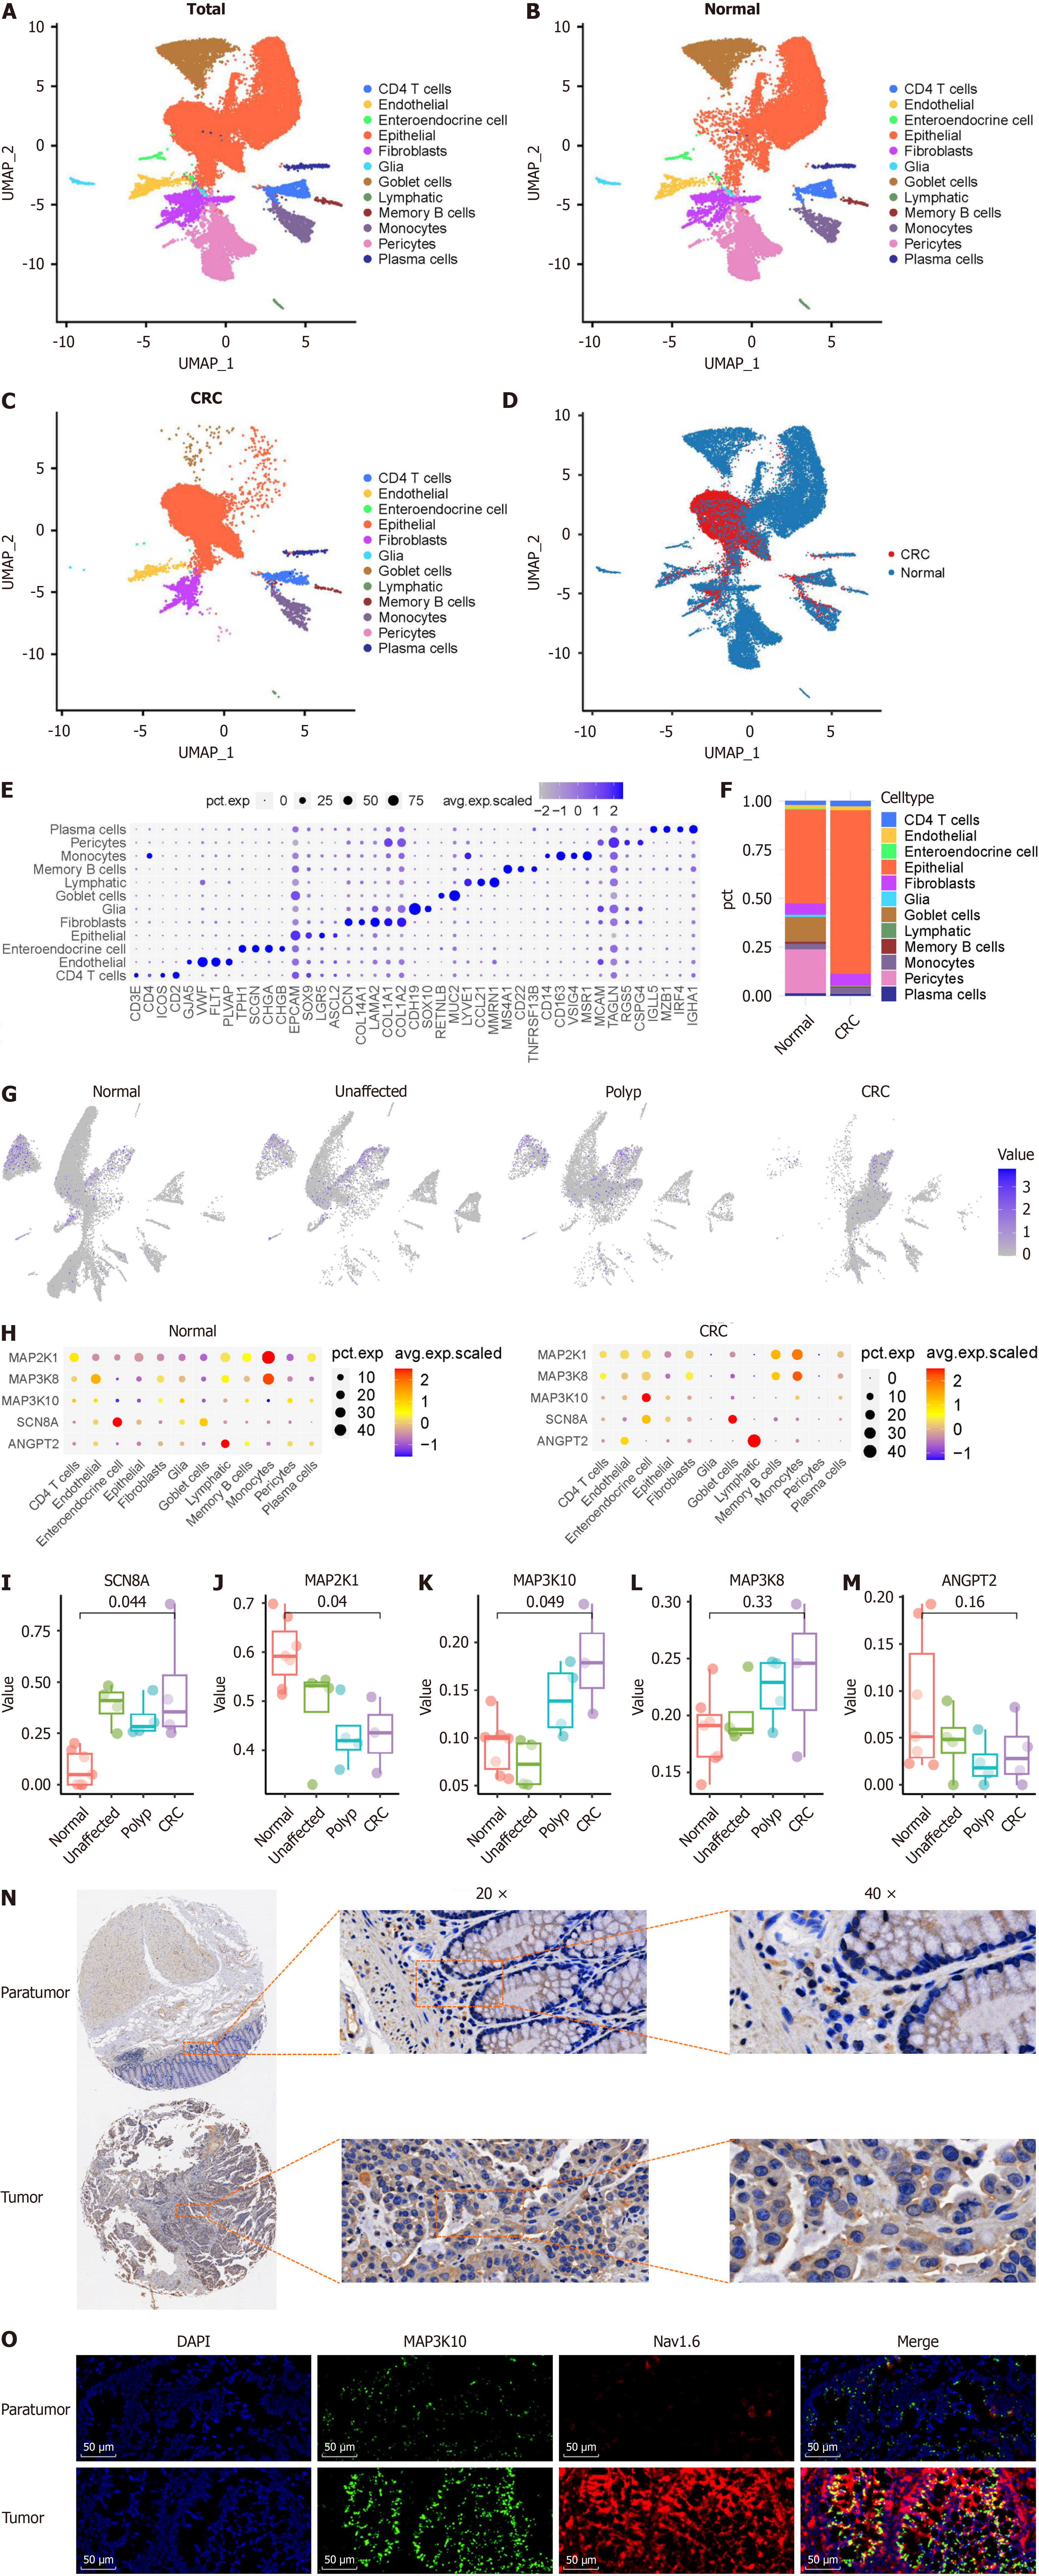
Figure 4 Expression distribution of top differentially expressed genes enriched in different cell types by KEGG analysis.
A-D: UMAP visualization of single cells in normal colon tissue and tumor tissue. Each dot represents a cell, color-coded by cell type; E: Dot plot showing the top three marker genes for each identified cell type. The size of each dot indicates the proportion of the cell population expressing each gene, while the color reflects the expression level; F: Bar graph representing the average proportion of different cell types in normal and tumor tissues; G: UMAP distribution of Nav1.6 expression in different cell types in normal colon tissue and tumor tissue; H: Bubble plot showing the relative expression of differentially expressed genes enriched according to weighted correlation network analysis. The color and size of the dot represent the average expression and the percentage of positively expressed hepatocytes in each cluster, respectively; I-M: Expression of Nav1.6-related MAPK genes in epithelial cells in different stages of colorectal cancer; N: Tumor tissue microarray analysis of expression of MAP3K10 in tumor tissues and paratumor tissues; O: Immunofluorescence analysis of expression of MAP3K10 and Nav1.6 in tumor tissues and paratumor tissues. CRC: Colorectal cancer.
- Citation: Zhao LM, Hong WY, Xu JG, Lin SQ, Liu MS, Wang LH, Jiang XL, Sang M, Lv YB. Nav1.6 drives colorectal cancer proliferation and invasion through MAPK signaling pathway. World J Gastrointest Oncol 2025; 17(7): 105264
- URL: https://www.wjgnet.com/1948-5204/full/v17/i7/105264.htm
- DOI: https://dx.doi.org/10.4251/wjgo.v17.i7.105264