Copyright
©The Author(s) 2025.
World J Gastrointest Oncol. Jul 15, 2025; 17(7): 105264
Published online Jul 15, 2025. doi: 10.4251/wjgo.v17.i7.105264
Published online Jul 15, 2025. doi: 10.4251/wjgo.v17.i7.105264
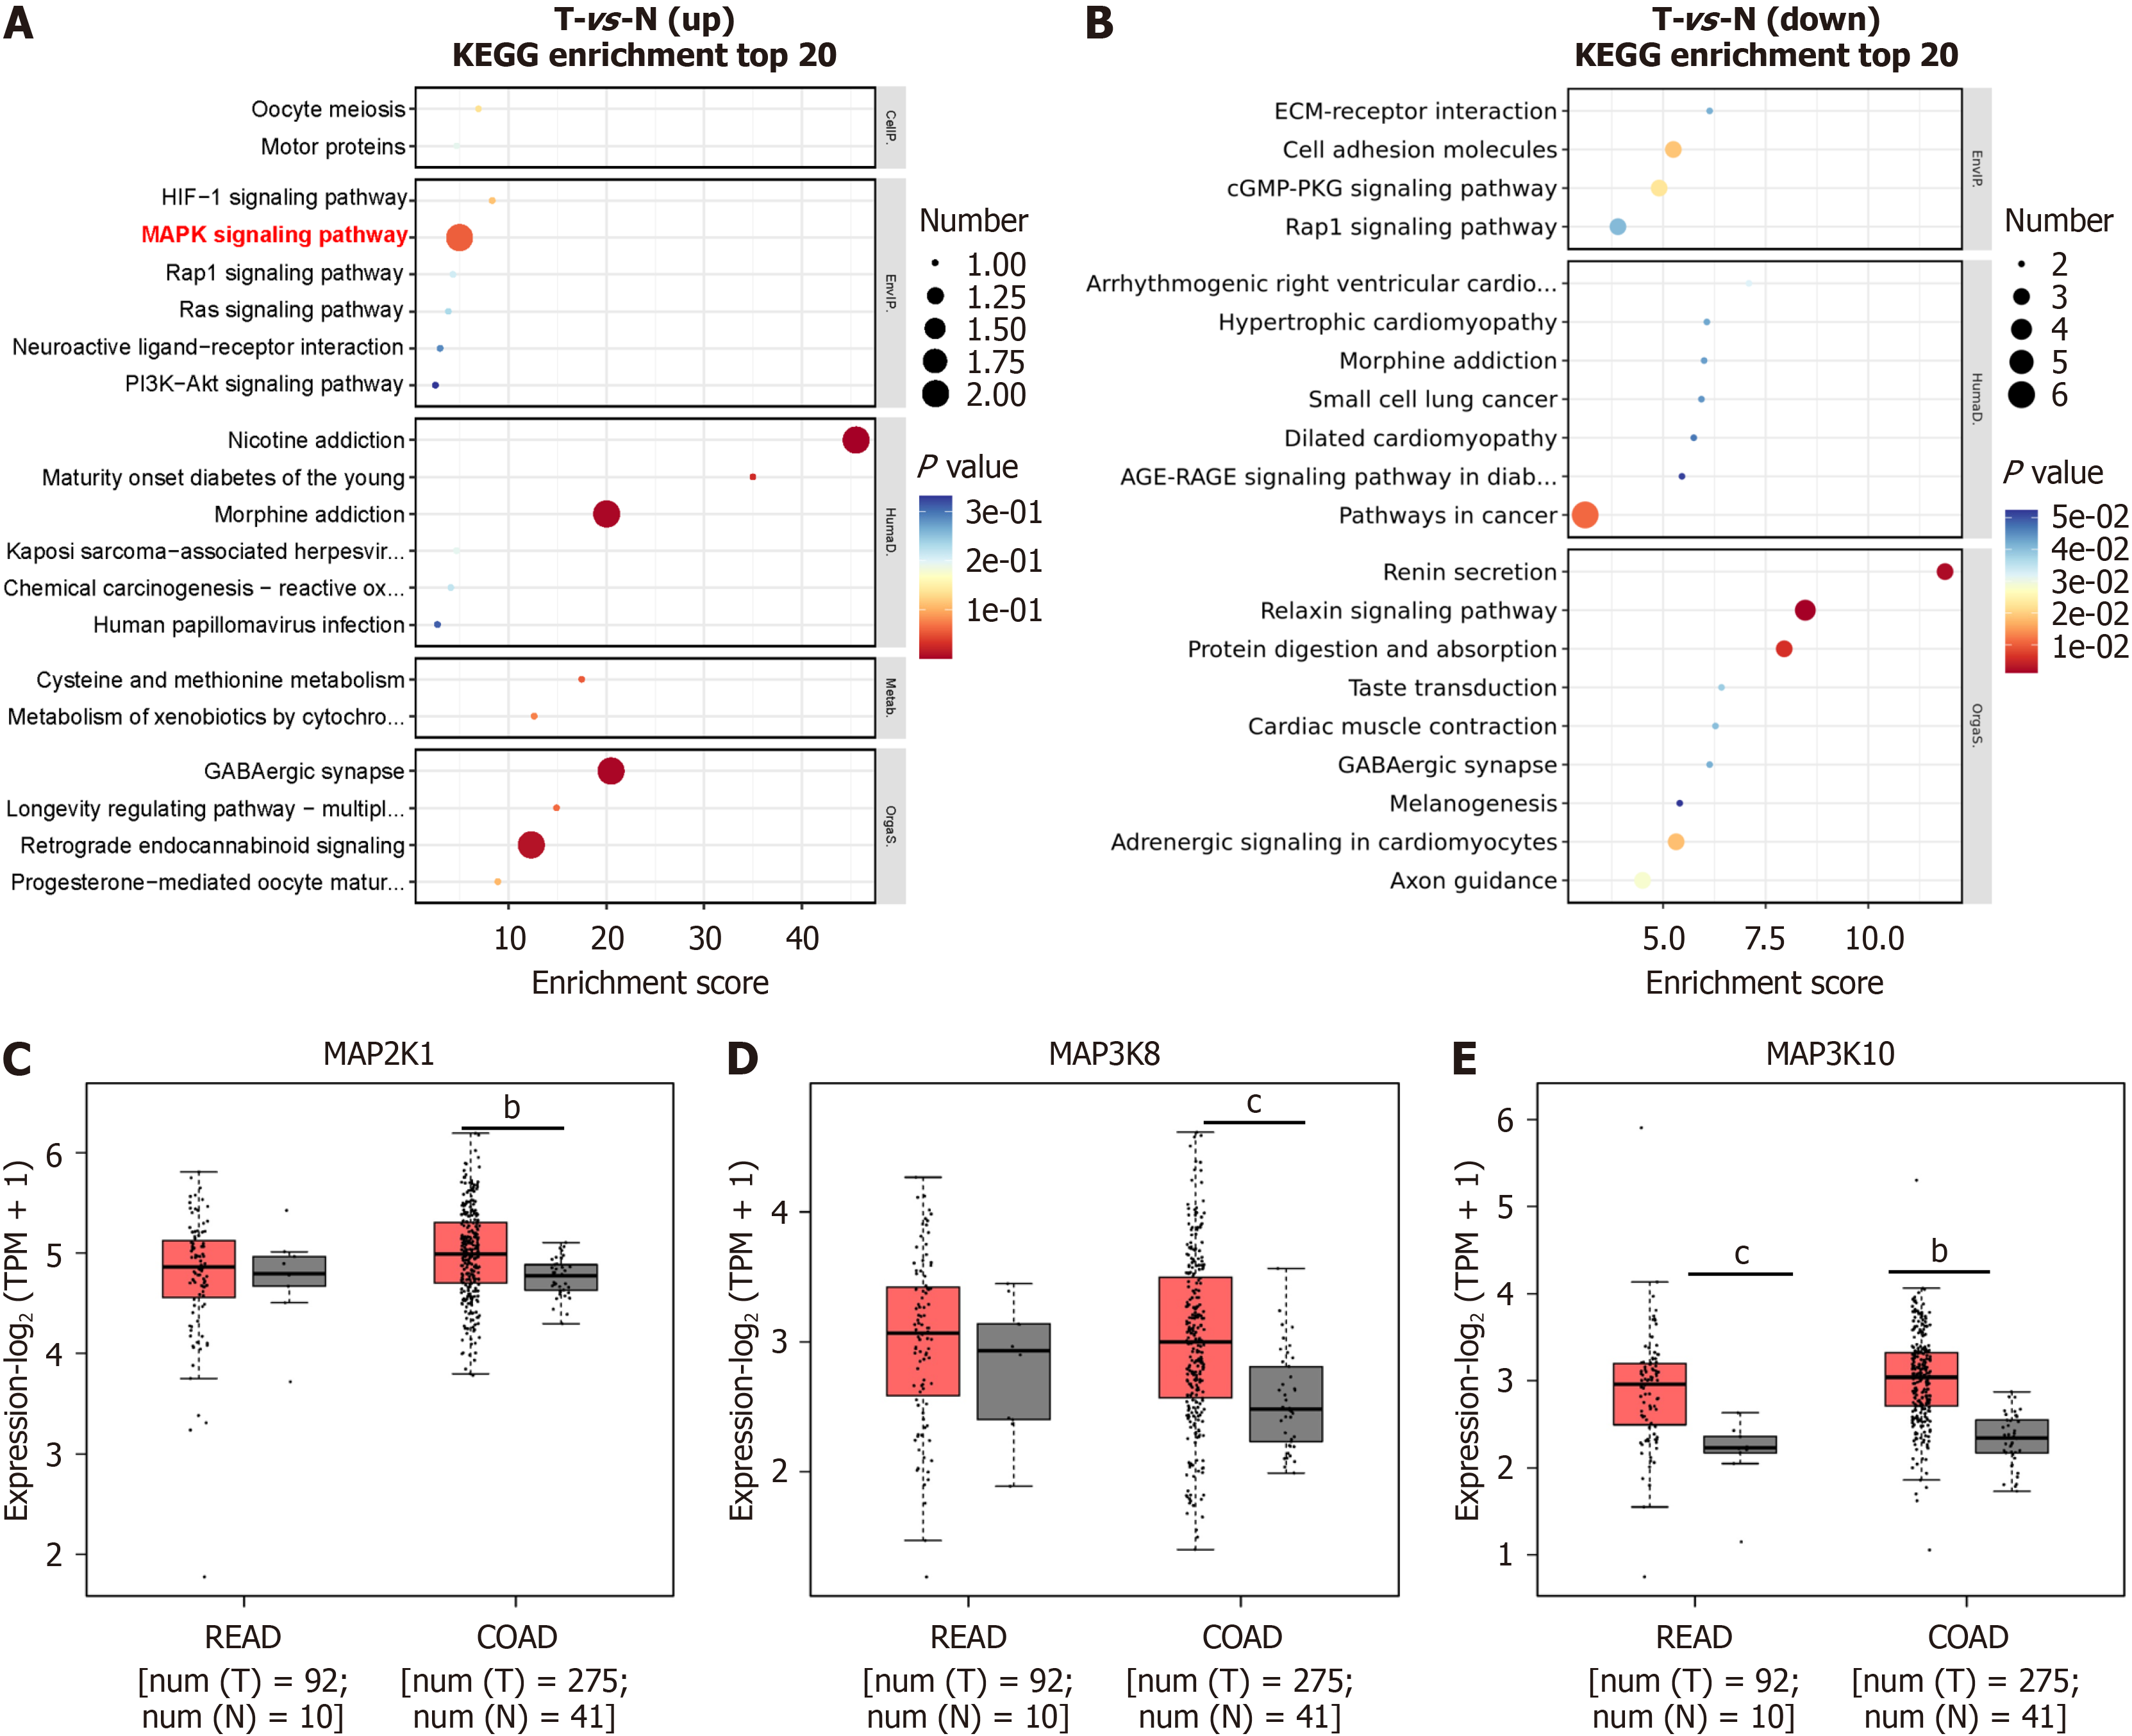
Figure 3 KEGG enrichment analysis of Nav1.
6-related differentially expressed genes from weighted correlation network analysis-enriched molecules. A and B: KEGG pathway analysis of differentially expressed genes (DEGs). Upregulated DEGs are shown in red (A), while downregulated DEGs are shown in blue (B). The advanced bubble chart shows the top 20 enriched signaling pathways for DEGs. The X-axis represents the rich factor (rich factor = number of DEGs enriched in the pathway/total number of genes in the background gene set), and the Y-axis represents the enriched pathway. The color indicates the significance of the enrichment, and the size of the bubble corresponds to the number of DEGs enriched in the pathway; C-E: Expression of KEGG-enriched MAPK genes in colon and rectal cancer tissues. bP < 0.01; cP < 0.001; READ: Rectal adenocarcinoma; COAD: Colon adenocarcinoma.
- Citation: Zhao LM, Hong WY, Xu JG, Lin SQ, Liu MS, Wang LH, Jiang XL, Sang M, Lv YB. Nav1.6 drives colorectal cancer proliferation and invasion through MAPK signaling pathway. World J Gastrointest Oncol 2025; 17(7): 105264
- URL: https://www.wjgnet.com/1948-5204/full/v17/i7/105264.htm
- DOI: https://dx.doi.org/10.4251/wjgo.v17.i7.105264


