Copyright
©The Author(s) 2025.
World J Gastrointest Oncol. Jul 15, 2025; 17(7): 105264
Published online Jul 15, 2025. doi: 10.4251/wjgo.v17.i7.105264
Published online Jul 15, 2025. doi: 10.4251/wjgo.v17.i7.105264
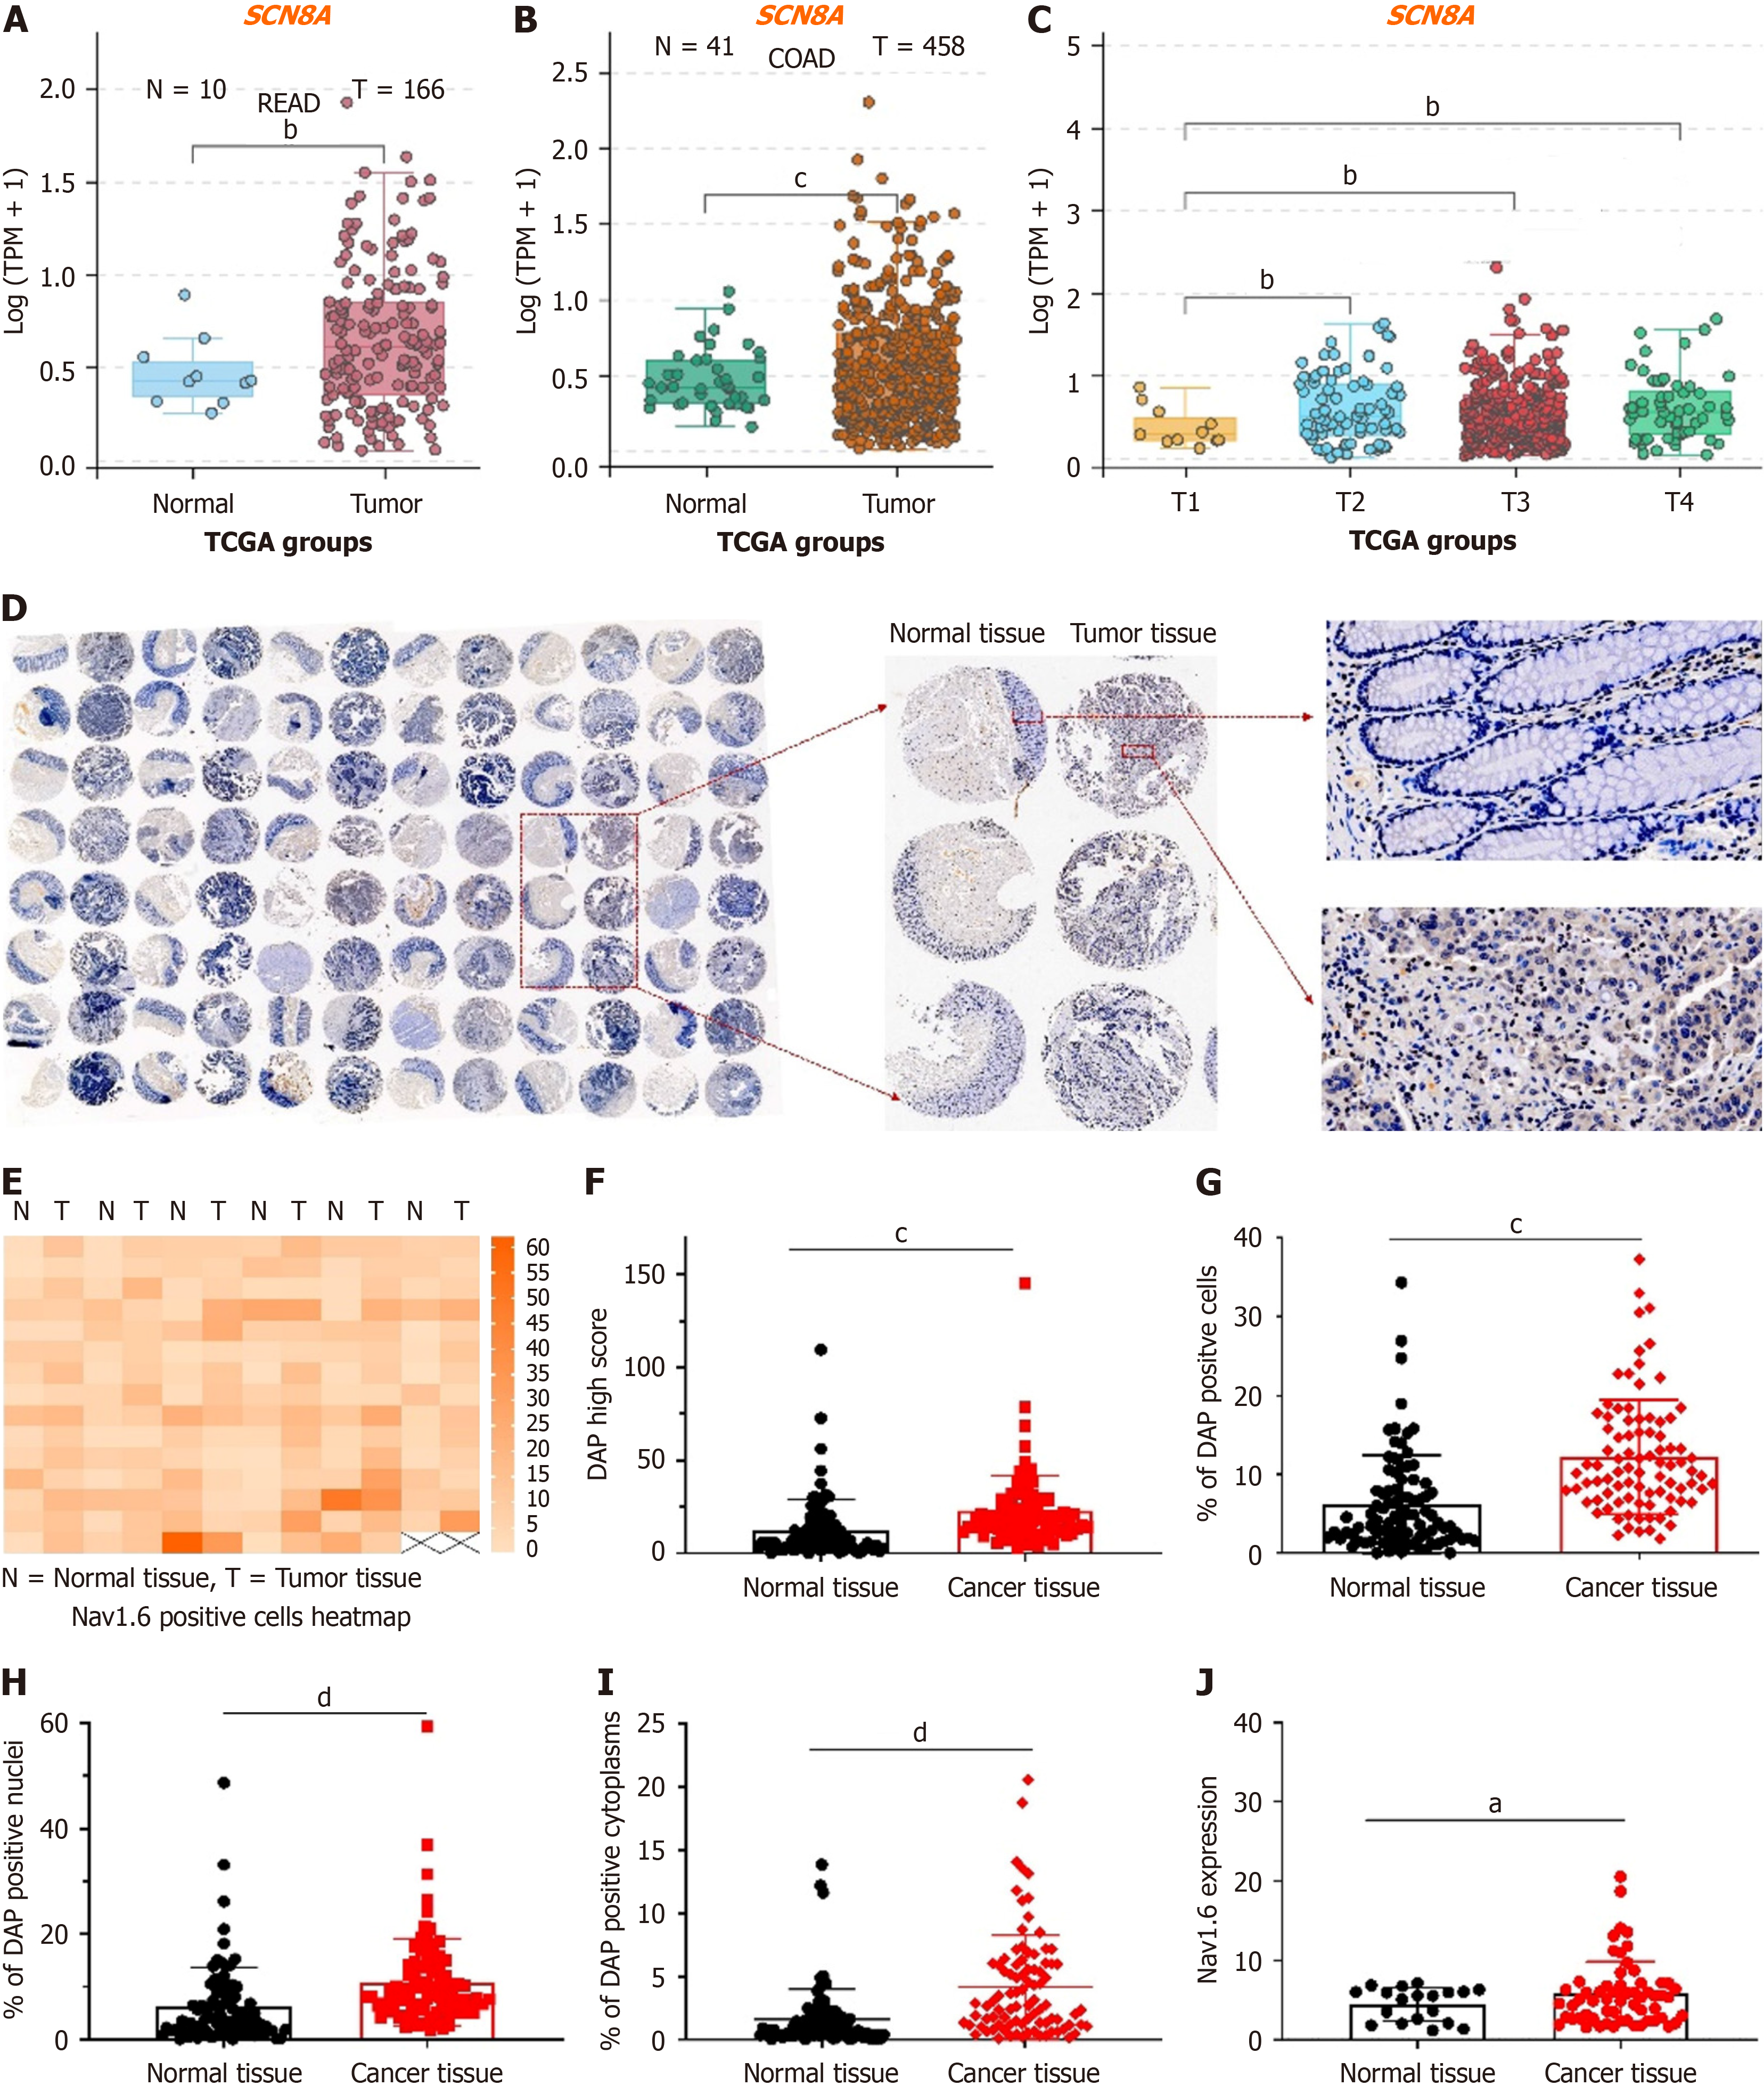
Figure 1 Expression of SCN8A (Nav1.
6) in colorectal cancer cells. A and B: Expression of Nav1.6 in rectal adenocarcinoma and colon adenocarcinoma. Each dot represents a patient; C: Expression of Nav1.6 in different stages of colorectal cancer; D: Representative images of immunohistochemical staining of Nav1.6 in cancer tissues and adjacent normal tissues from 90 colorectal cancer (CRC) patients; E: Heatmap showing the expression level of Nav1.6 in tumor and normal colon tissues after staining with Nav1.6 antibody. The orange-red color indicates a high quantitative value, while white represents a low quantitative value; F: H-Score of Nav1.6 signal intensity in 97 cancer and adjacent tissues; G-I: Proportion of DAP-positive cells (G), positive nuclei (H), and positive cytoplasm (I) in cancer and normal colon tissues; J: Cytoplasmic expression of Nav1.6 in different stages of CRC. aP < 0.05; bP < 0.01; cP < 0.001; dP < 0.0001; READ: Rectal adenocarcinoma; COAD: Colon adenocarcinoma; TCGA: The Cancer Genome Atlas.
- Citation: Zhao LM, Hong WY, Xu JG, Lin SQ, Liu MS, Wang LH, Jiang XL, Sang M, Lv YB. Nav1.6 drives colorectal cancer proliferation and invasion through MAPK signaling pathway. World J Gastrointest Oncol 2025; 17(7): 105264
- URL: https://www.wjgnet.com/1948-5204/full/v17/i7/105264.htm
- DOI: https://dx.doi.org/10.4251/wjgo.v17.i7.105264


