Copyright
©The Author(s) 2025.
World J Gastrointest Oncol. Jun 15, 2025; 17(6): 107919
Published online Jun 15, 2025. doi: 10.4251/wjgo.v17.i6.107919
Published online Jun 15, 2025. doi: 10.4251/wjgo.v17.i6.107919
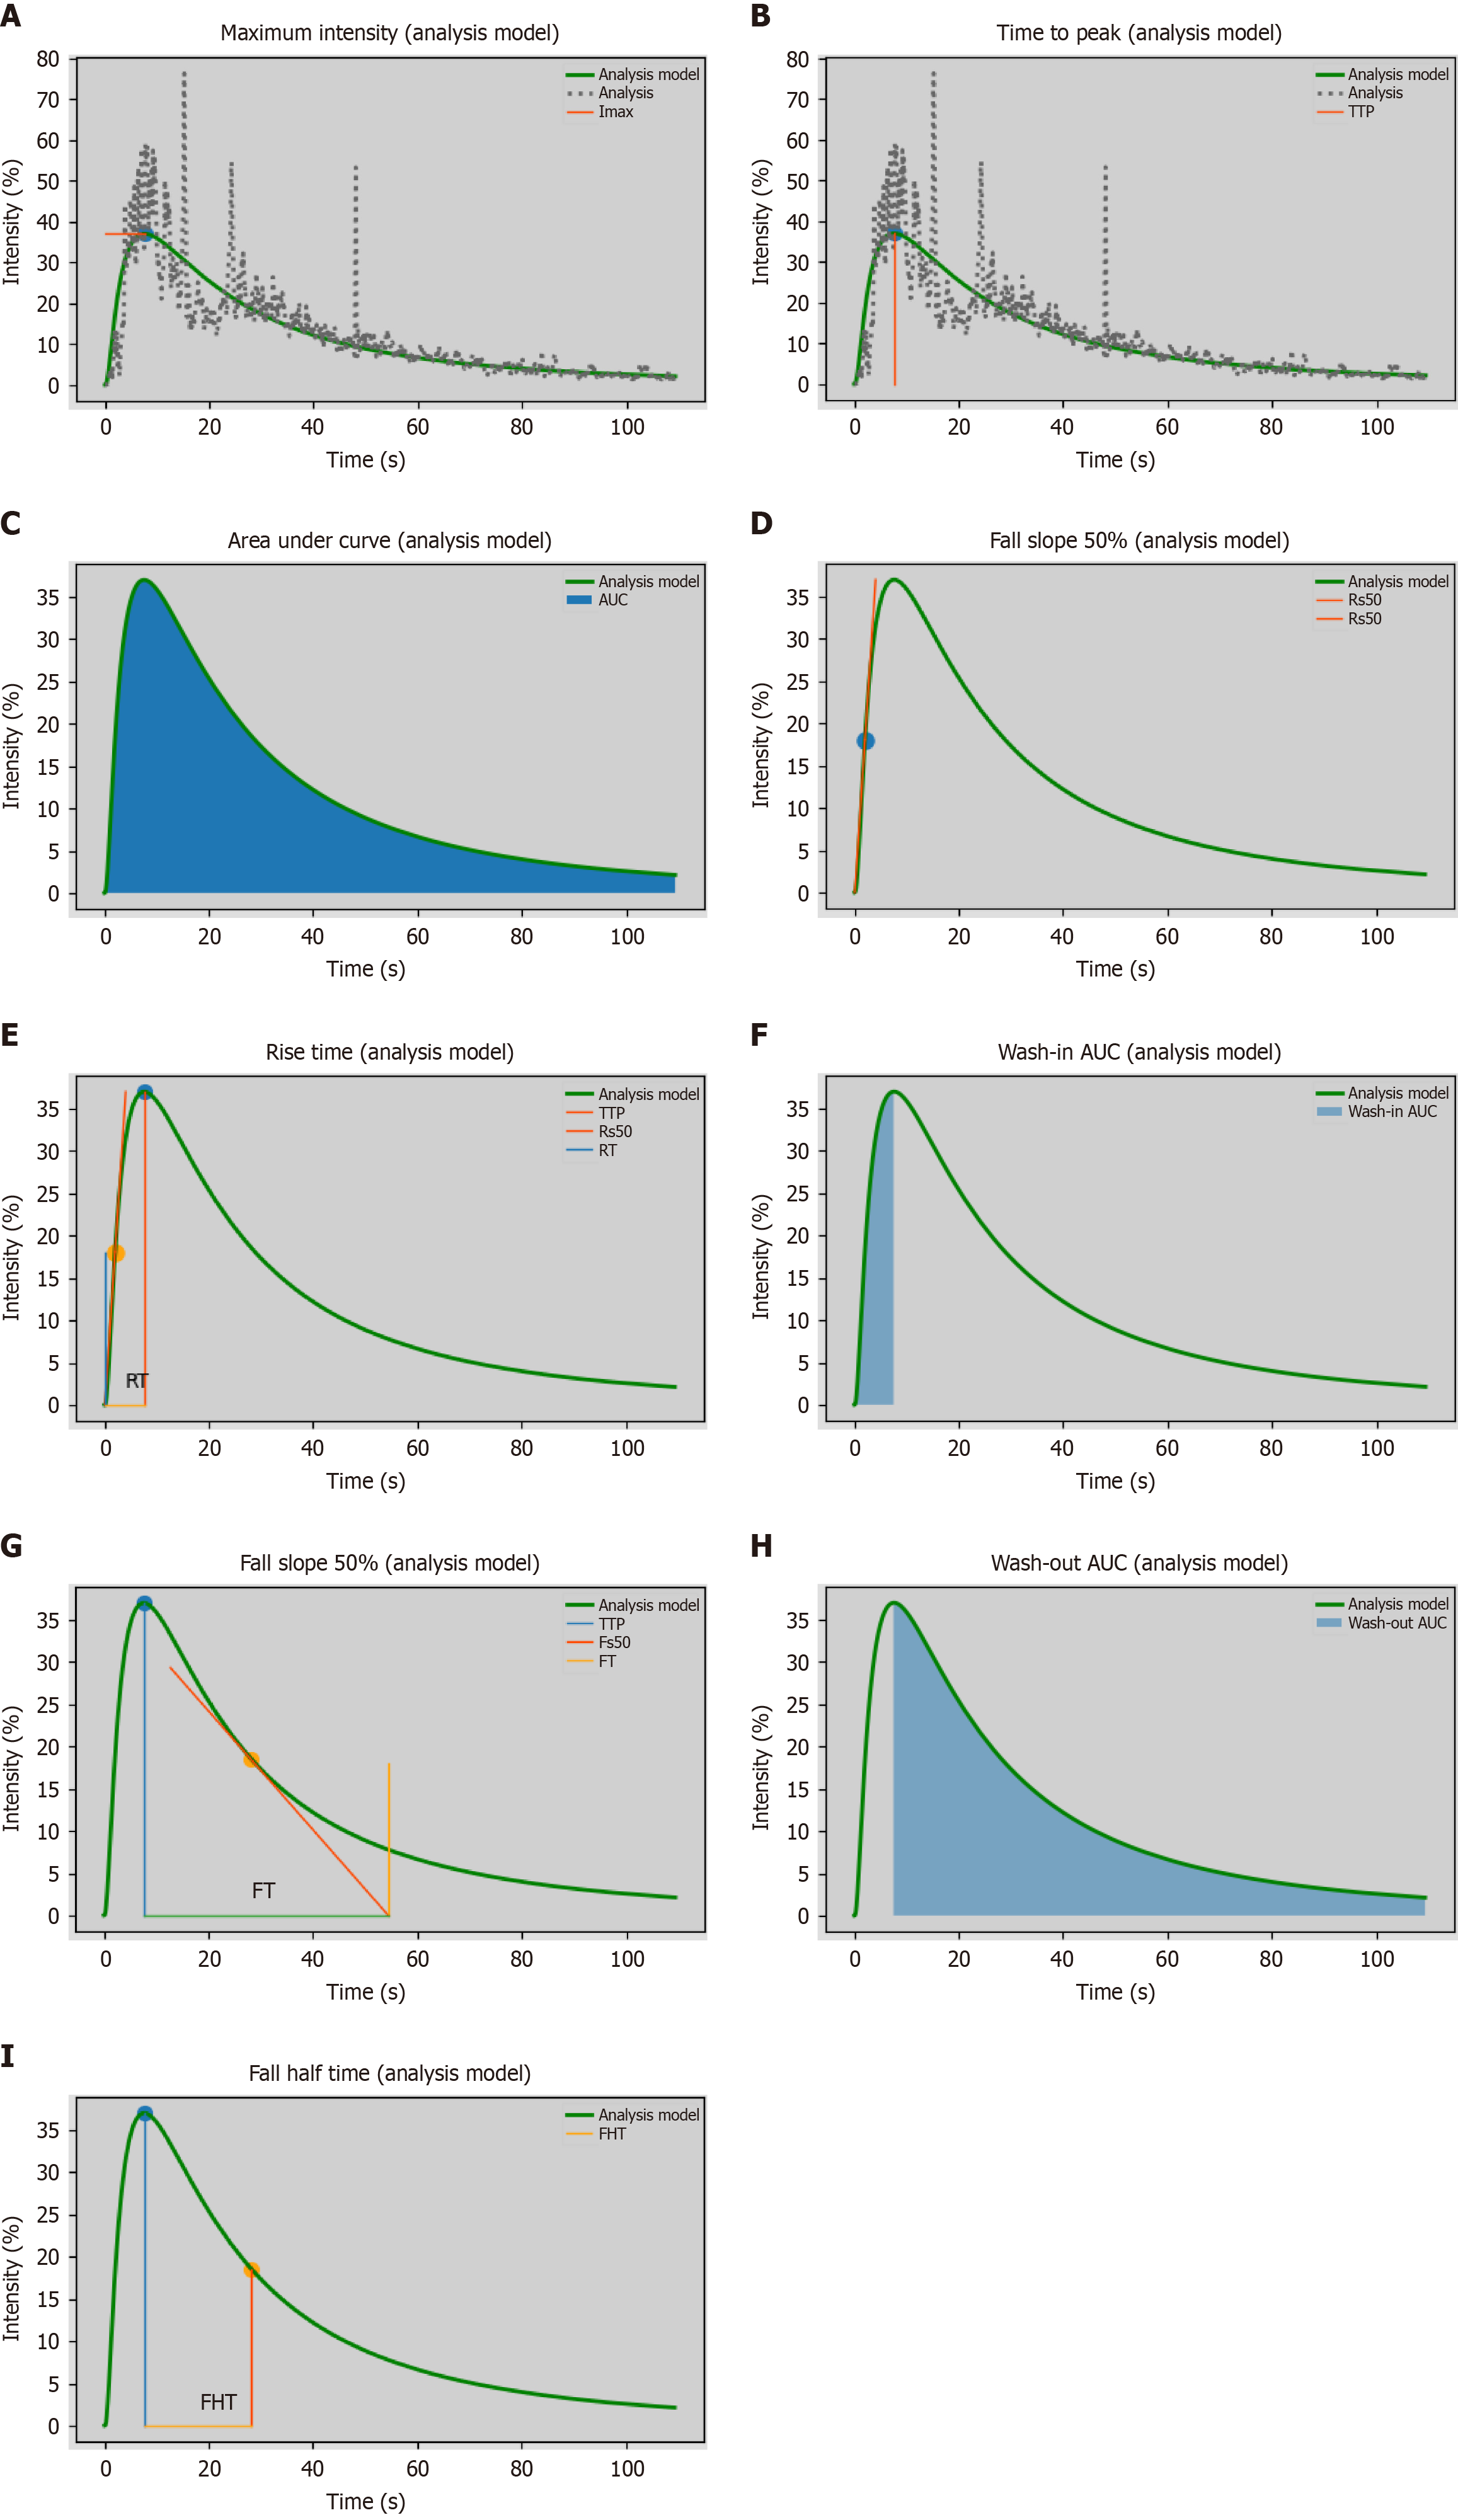
Figure 3 Schematic diagram of various contrast-enhanced ultrasound quantitative.
A: Maximum intensity; B: Time to peak; C: Area under the curve; D: Rise slope 50%; E: Rise time; F: Wash-in area under the curve; G: Falling time; H: Wash-out area under the curve; I: Falling half time. IMAX: Maximum intensity; TTP: Time to peak; AUC: Area under the curve; Rs50: Rise slope 50%; RT: Rise time; FT: Falling time; Fs50: Falling slope 50%; FHT: Falling half time.
- Citation: Yang ZY, Wan WN, Zhao L, Li SN, Liu Z, Sang L. Noninvasive prediction of Ki-67 expression in pancreatic cancer via contrast-enhanced ultrasound quantitative parameters: A diagnostic model study. World J Gastrointest Oncol 2025; 17(6): 107919
- URL: https://www.wjgnet.com/1948-5204/full/v17/i6/107919.htm
- DOI: https://dx.doi.org/10.4251/wjgo.v17.i6.107919


