Copyright
©The Author(s) 2025.
World J Gastrointest Oncol. Jun 15, 2025; 17(6): 107919
Published online Jun 15, 2025. doi: 10.4251/wjgo.v17.i6.107919
Published online Jun 15, 2025. doi: 10.4251/wjgo.v17.i6.107919
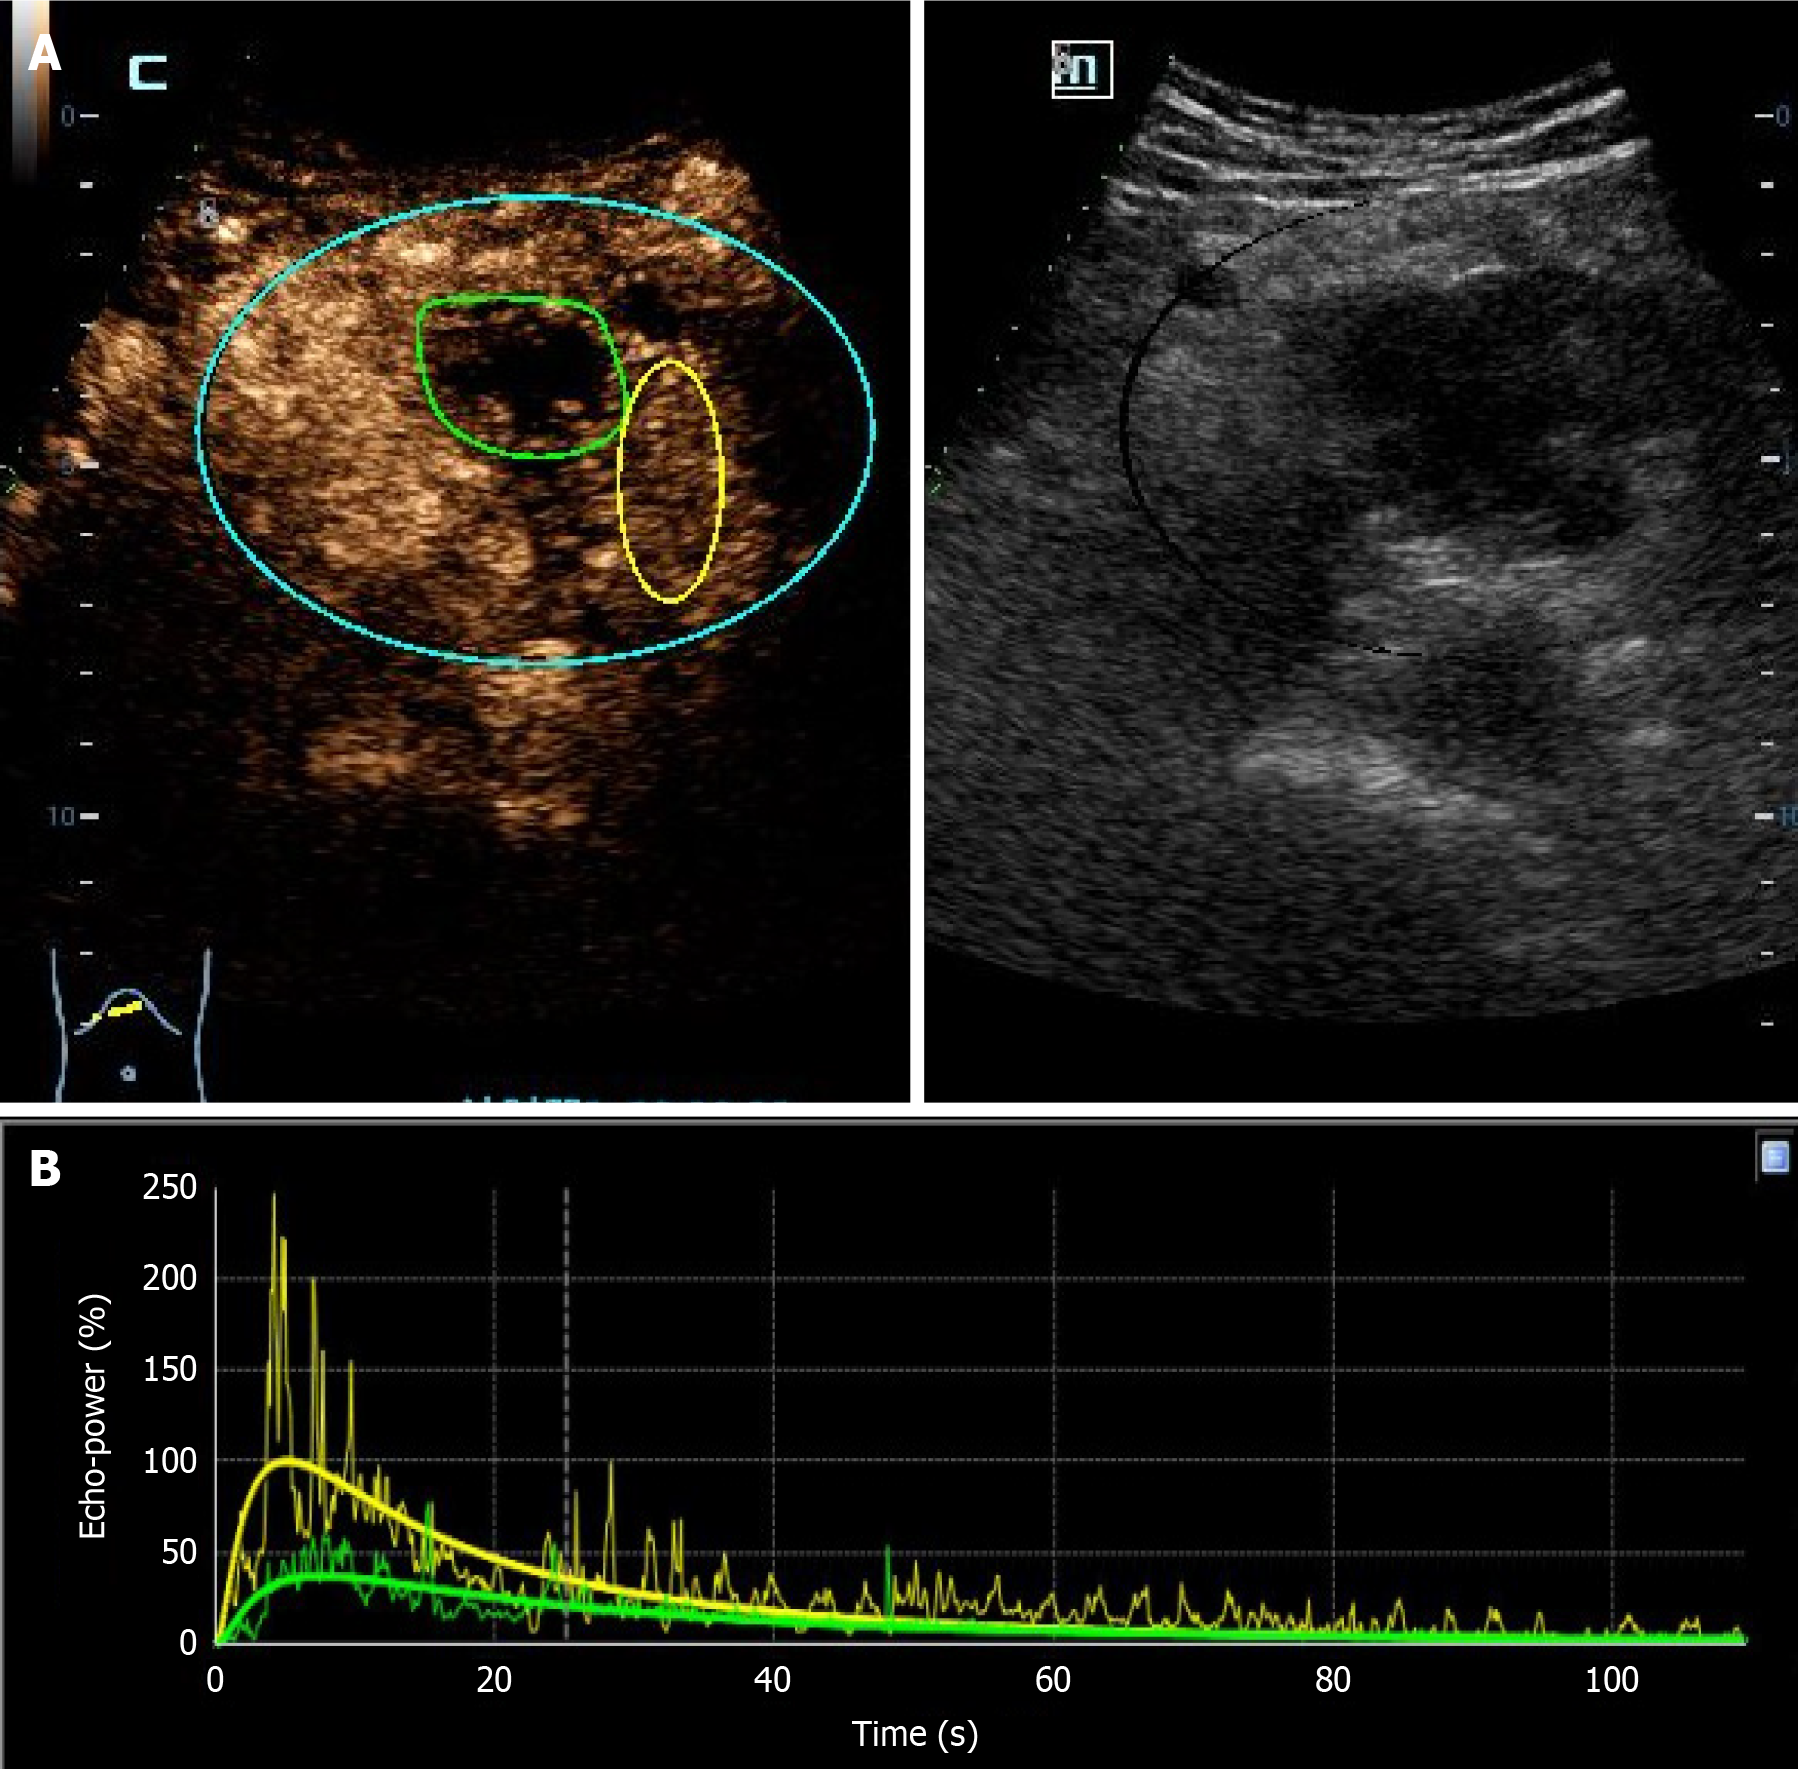
Figure 2 Lesion delineation and time-intensity curve.
A: The delineation area of the region of interest of pancreatic cancer; B: The time-intensity curve. The yellow coil represents the normal pancreatic gland, and the green coil represents the lesion area of pancreatic cancer. Taking the normal pancreatic gland as the control, B shows the time-intensity curves of the two.
- Citation: Yang ZY, Wan WN, Zhao L, Li SN, Liu Z, Sang L. Noninvasive prediction of Ki-67 expression in pancreatic cancer via contrast-enhanced ultrasound quantitative parameters: A diagnostic model study. World J Gastrointest Oncol 2025; 17(6): 107919
- URL: https://www.wjgnet.com/1948-5204/full/v17/i6/107919.htm
- DOI: https://dx.doi.org/10.4251/wjgo.v17.i6.107919


