Copyright
©The Author(s) 2025.
World J Gastrointest Oncol. Jun 15, 2025; 17(6): 106080
Published online Jun 15, 2025. doi: 10.4251/wjgo.v17.i6.106080
Published online Jun 15, 2025. doi: 10.4251/wjgo.v17.i6.106080
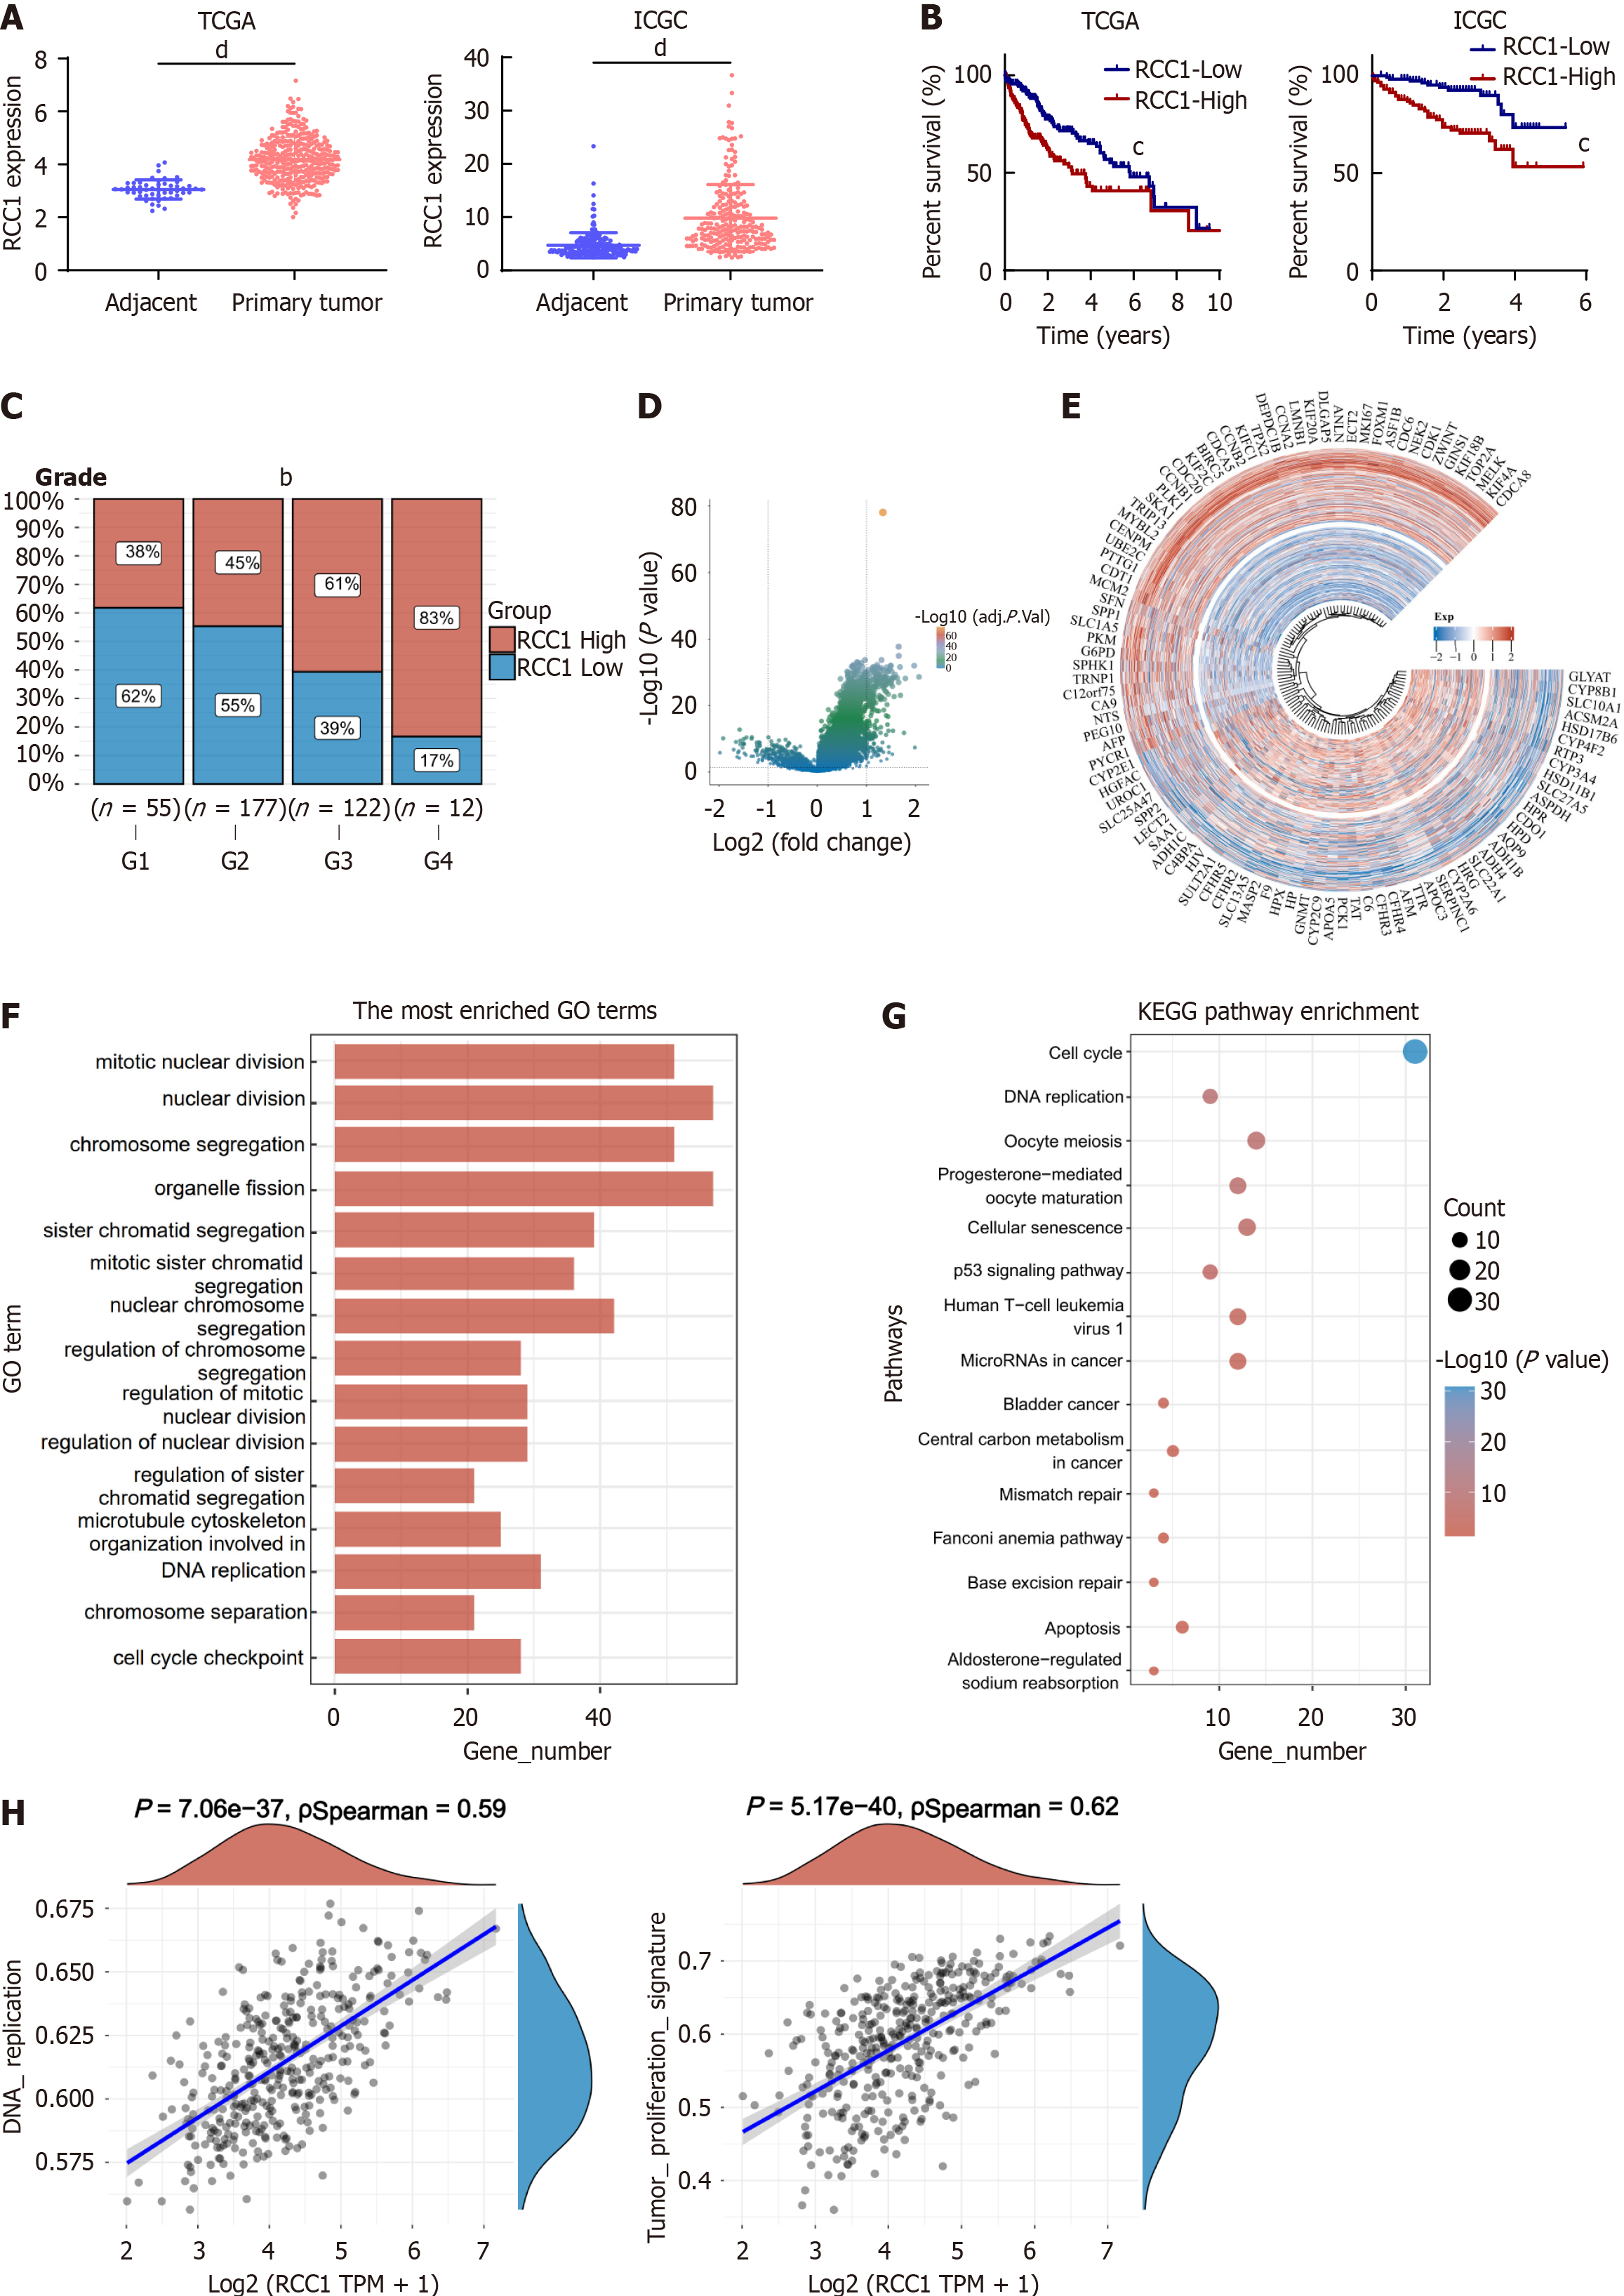
Figure 1 Bioinformatics analysis shows regulator of chromosome condensation 1 expression and its association with poor prognosis in hepatocellular carcinoma patients.
bP < 0.01, cP < 0.001, dP < 0.0001. A: Regulator of chromosome condensation 1 (RCC1) expression levels in The Cancer Genome Atlas (TCGA) and International Cancer Genome Consortium databases; B: Prognostic analysis of high vs low RCC1 expression in TCGA and International Cancer Genome Consortium databases; C: Pathologic grade analysis of high vs low RCC1 expression in TCGA database; D: Volcano plot of differentially expressed genes between high and low RCC1 expression in TCGA database; E: Heatmap displaying top 50 upregulated genes and downregulated genes with greatest differential changes; F: Functional enrichment analysis: Gene Ontology term enrichment results of differentially upregulated genes; G: Functional enrichment analysis: Kyoto Encyclopedia of Genes and Genomes pathway enrichment of differentially upregulated genes; H: Spearman correlation analysis of gene expression and pathway scores. TCGA: The Cancer Genome Atlas; ICGC: International Cancer Genome Consortium; RCC1: Regulator of chromosome condensation 1; GO: Gene Ontology.
- Citation: Wang YT, Yong YL, Liu ZK, Shen YX, Yang XM, Chen ZN. Regulator of chromosome condensation 1 promotes hepatocellular carcinoma proliferation via cell-division-cycle-associated-8 dependent phosphoinositide 3-kinase/protein kinase B signaling. World J Gastrointest Oncol 2025; 17(6): 106080
- URL: https://www.wjgnet.com/1948-5204/full/v17/i6/106080.htm
- DOI: https://dx.doi.org/10.4251/wjgo.v17.i6.106080


