Copyright
©The Author(s) 2025.
World J Gastrointest Oncol. Jun 15, 2025; 17(6): 105967
Published online Jun 15, 2025. doi: 10.4251/wjgo.v17.i6.105967
Published online Jun 15, 2025. doi: 10.4251/wjgo.v17.i6.105967
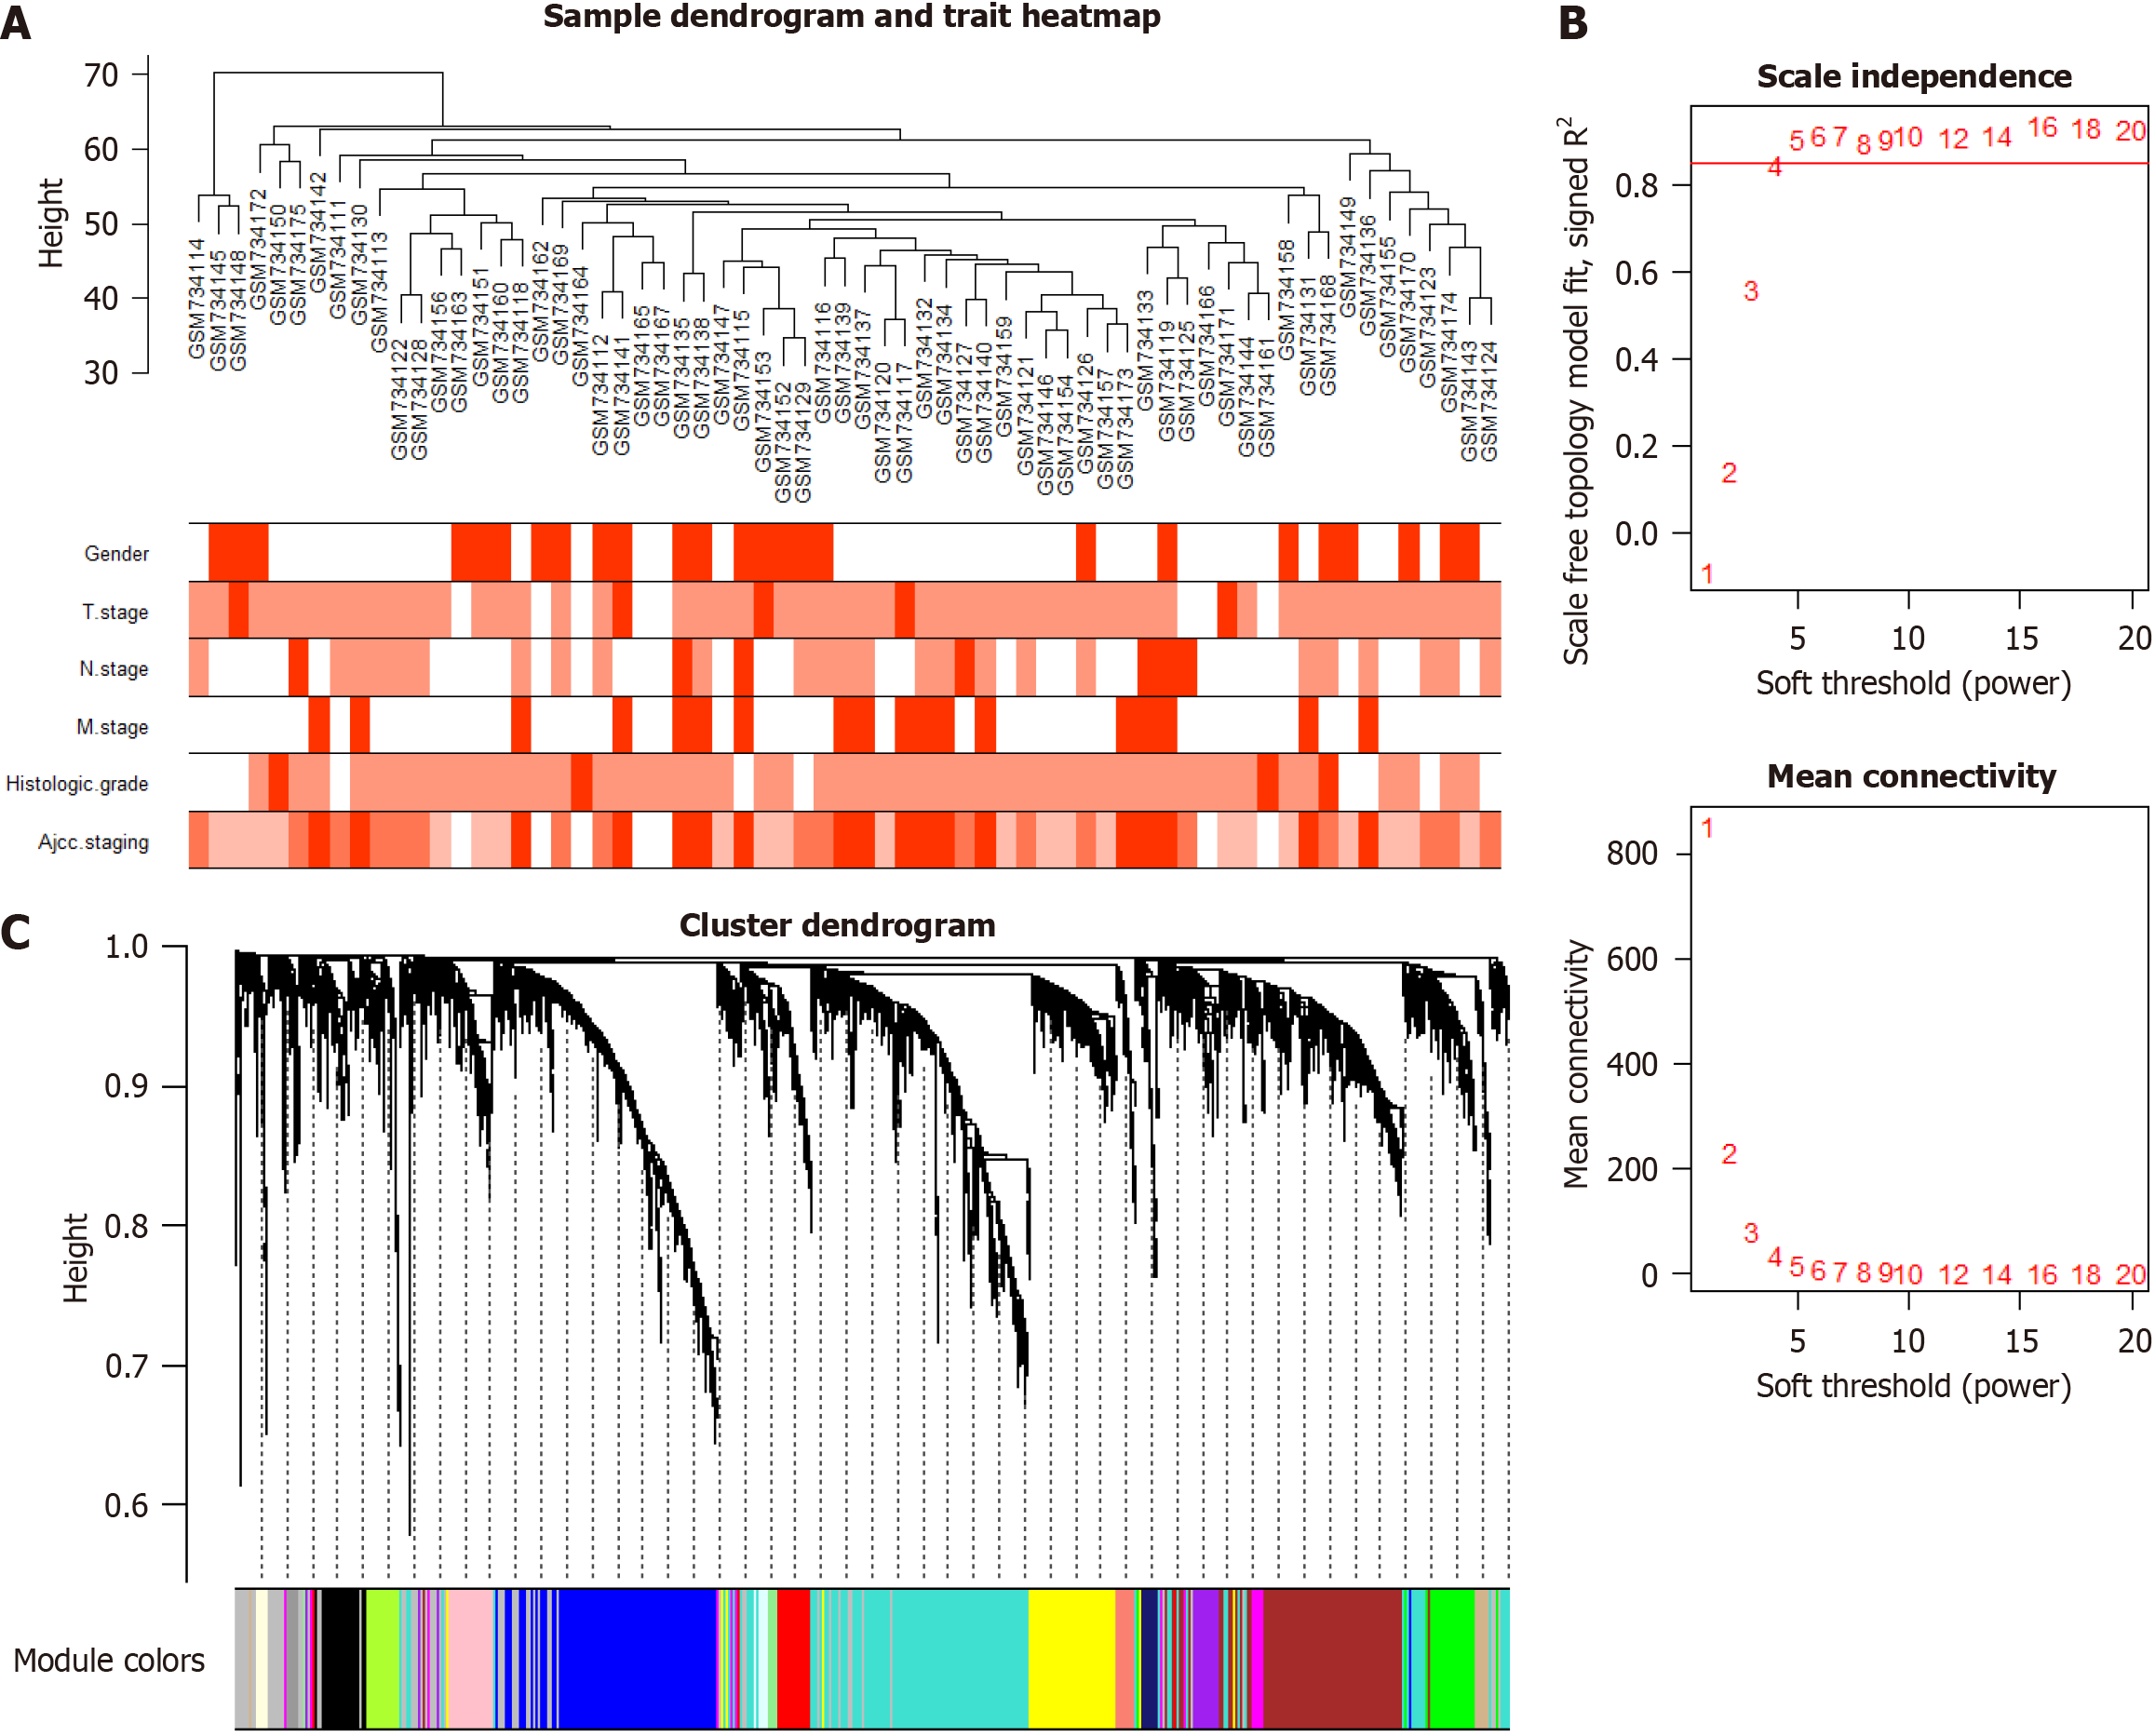
Figure 2 Network visualization.
A: Samples dendrogram cluster and the trait heatmap; B: The appropriate soft threshold power = 4 was selected; C: Gene cluster tree.
- Citation: Wei JR, Ouyang YN, Tang MT, Yuan JZ, Wang PL, Jiang LH, Wu LC. Charged multivesicular body protein 7 was identified as a prognostic biomarker correlated with metastasis in colorectal cancer. World J Gastrointest Oncol 2025; 17(6): 105967
- URL: https://www.wjgnet.com/1948-5204/full/v17/i6/105967.htm
- DOI: https://dx.doi.org/10.4251/wjgo.v17.i6.105967


