Copyright
©The Author(s) 2025.
World J Gastrointest Oncol. Jun 15, 2025; 17(6): 105790
Published online Jun 15, 2025. doi: 10.4251/wjgo.v17.i6.105790
Published online Jun 15, 2025. doi: 10.4251/wjgo.v17.i6.105790
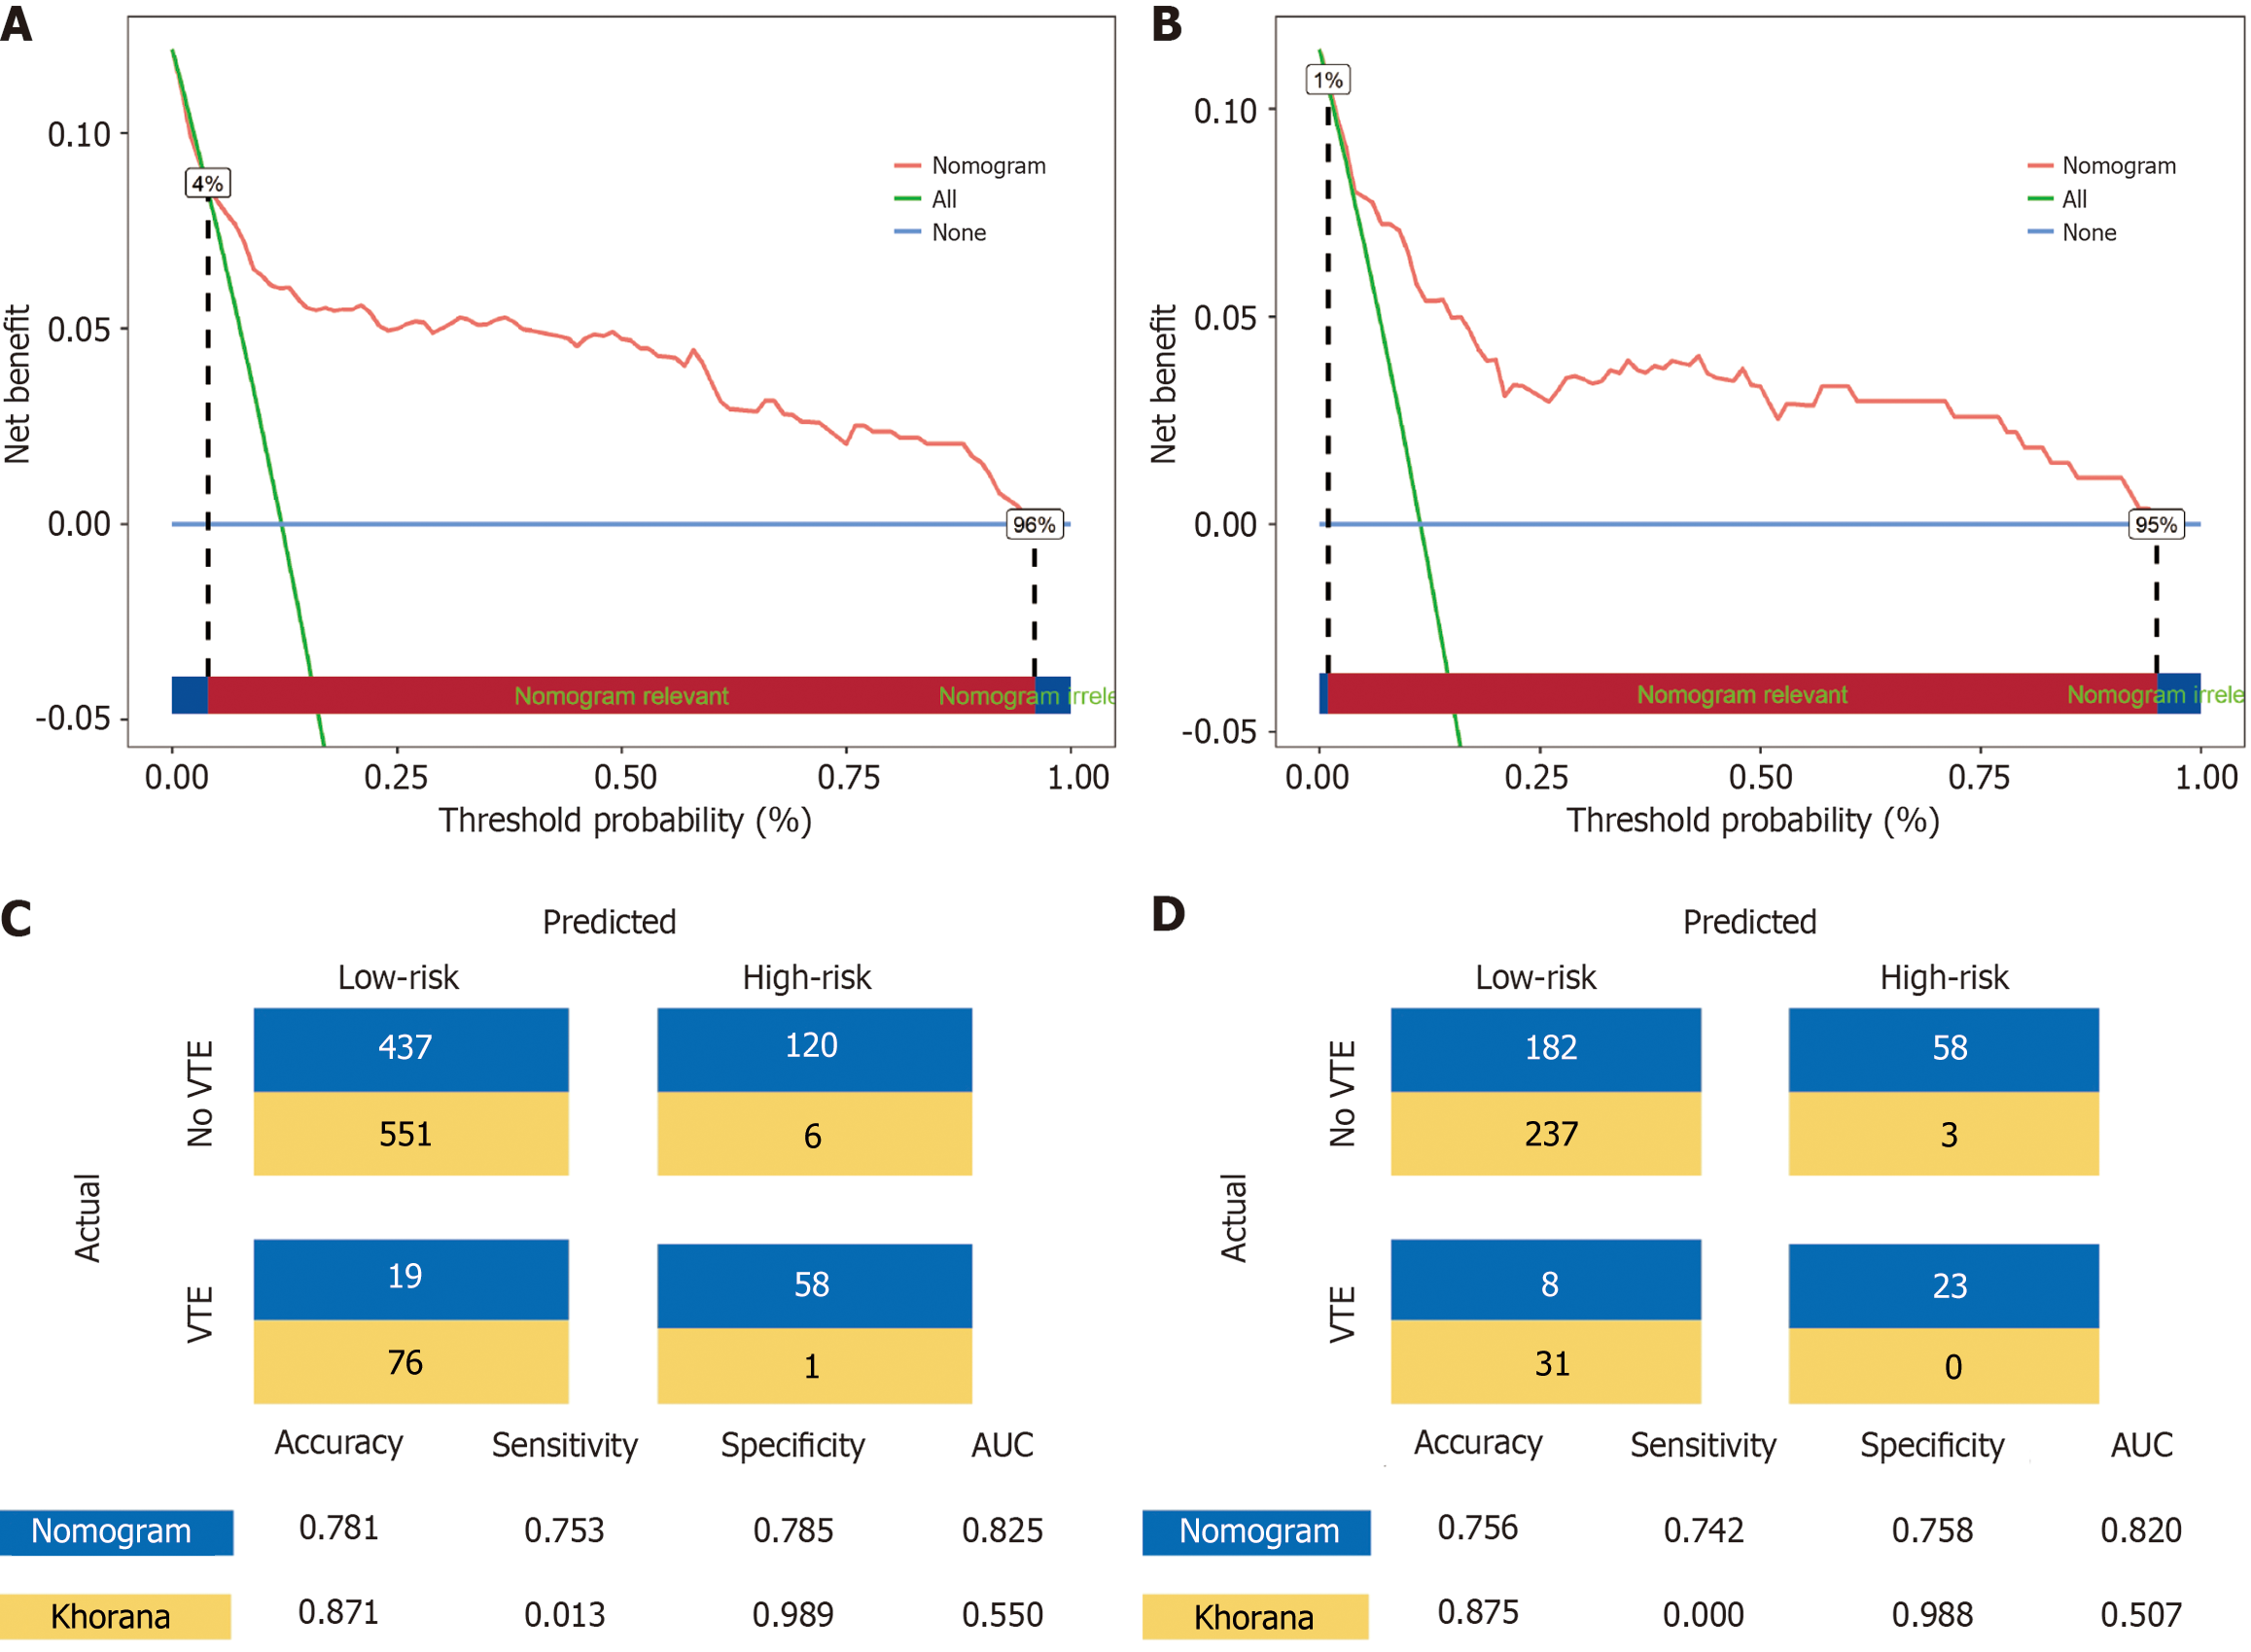
Figure 4 Decision curve analysis curve of the graph model.
A: Training cohort; B: Validation cohort; C: Training cohort. Comparison of the nomogram model with Khorana; D: Validation cohort. VTE: Venous thromboembolism; AUC: Area under the curve.
- Citation: Chen CR, Jin HL, Xu QJ, Yuan YL, Hu ZH, Liu Y, Lei HK. Development and validation of a nomogram for predicting postoperative venous thromboembolism risk in patients with hepatocellular carcinoma. World J Gastrointest Oncol 2025; 17(6): 105790
- URL: https://www.wjgnet.com/1948-5204/full/v17/i6/105790.htm
- DOI: https://dx.doi.org/10.4251/wjgo.v17.i6.105790


