Copyright
©The Author(s) 2025.
World J Gastrointest Oncol. Jun 15, 2025; 17(6): 105781
Published online Jun 15, 2025. doi: 10.4251/wjgo.v17.i6.105781
Published online Jun 15, 2025. doi: 10.4251/wjgo.v17.i6.105781
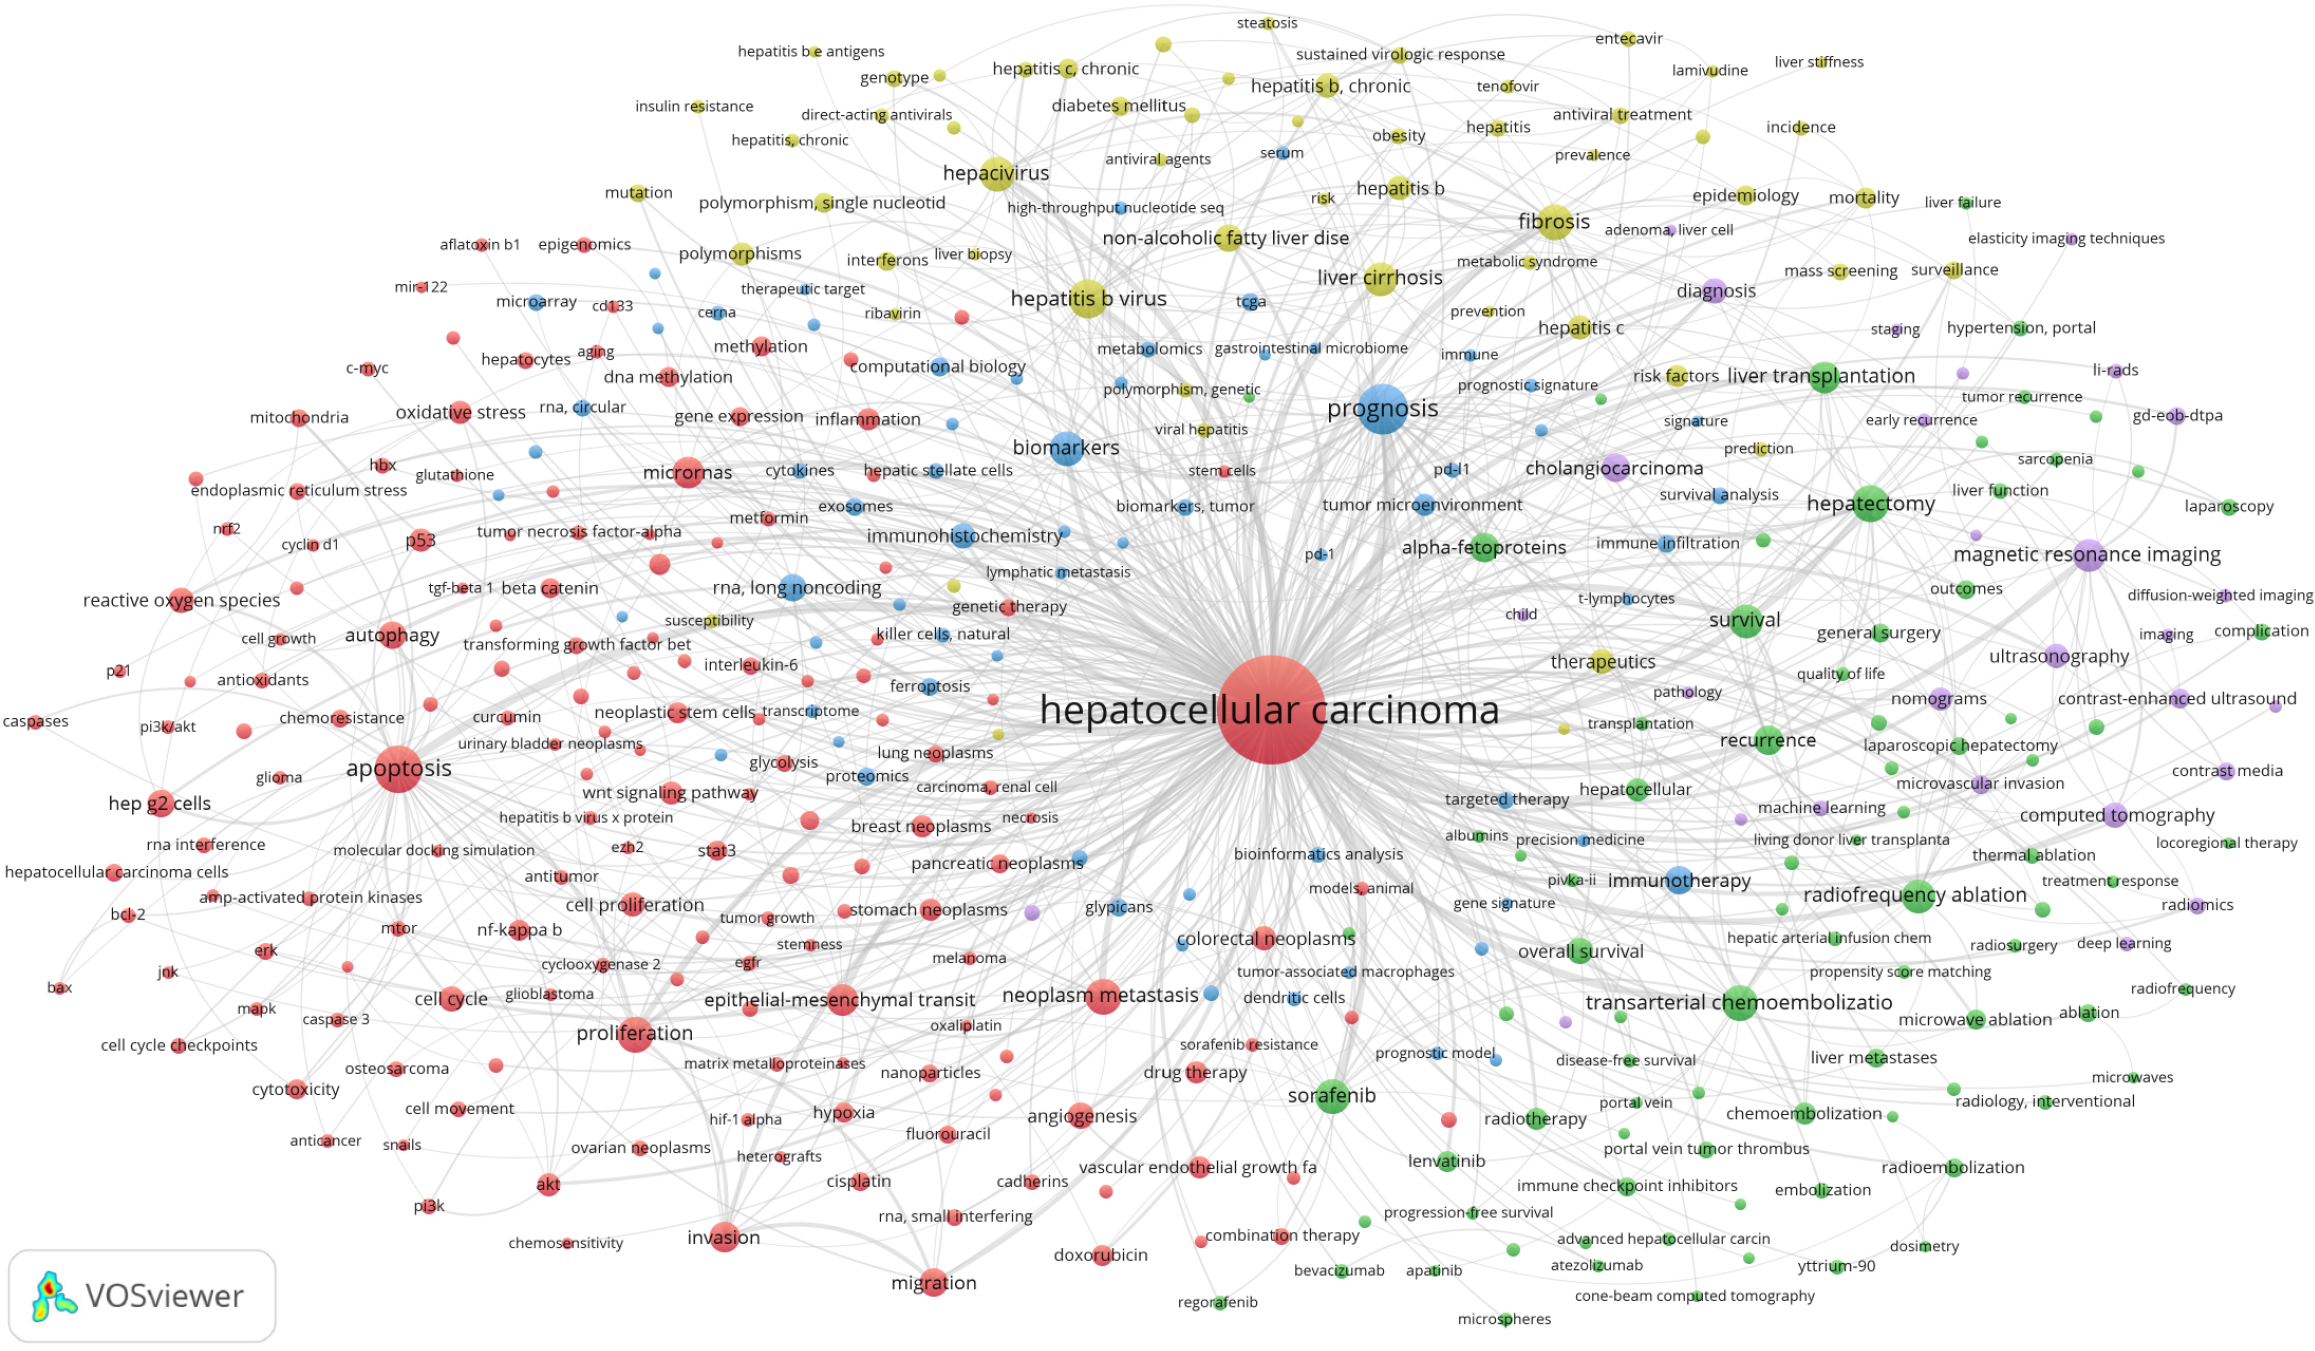
Figure 7 Network visualization map of keywords co-occurrence analysis on hepatocellular carcinoma.
Co-occurrence network map comprising 5 clusters (nodes with identical colors) formed by 391 high-frequency author keywords. Node labels display keywords, with node size proportional to keyword frequency, where larger nodes indicate higher occurrence rates.
- Citation: Shang LQ, Guo HX, Wang P, Sun XH, You JQ, Ma JT, Wang LK, Liu JX, Wang ZQ, Shao HB. Global scientific trends on hepatocellular carcinoma research from 2004 to 2023: A bibliometric and visualized analysis. World J Gastrointest Oncol 2025; 17(6): 105781
- URL: https://www.wjgnet.com/1948-5204/full/v17/i6/105781.htm
- DOI: https://dx.doi.org/10.4251/wjgo.v17.i6.105781


