Copyright
©The Author(s) 2025.
World J Gastrointest Oncol. Jun 15, 2025; 17(6): 105781
Published online Jun 15, 2025. doi: 10.4251/wjgo.v17.i6.105781
Published online Jun 15, 2025. doi: 10.4251/wjgo.v17.i6.105781
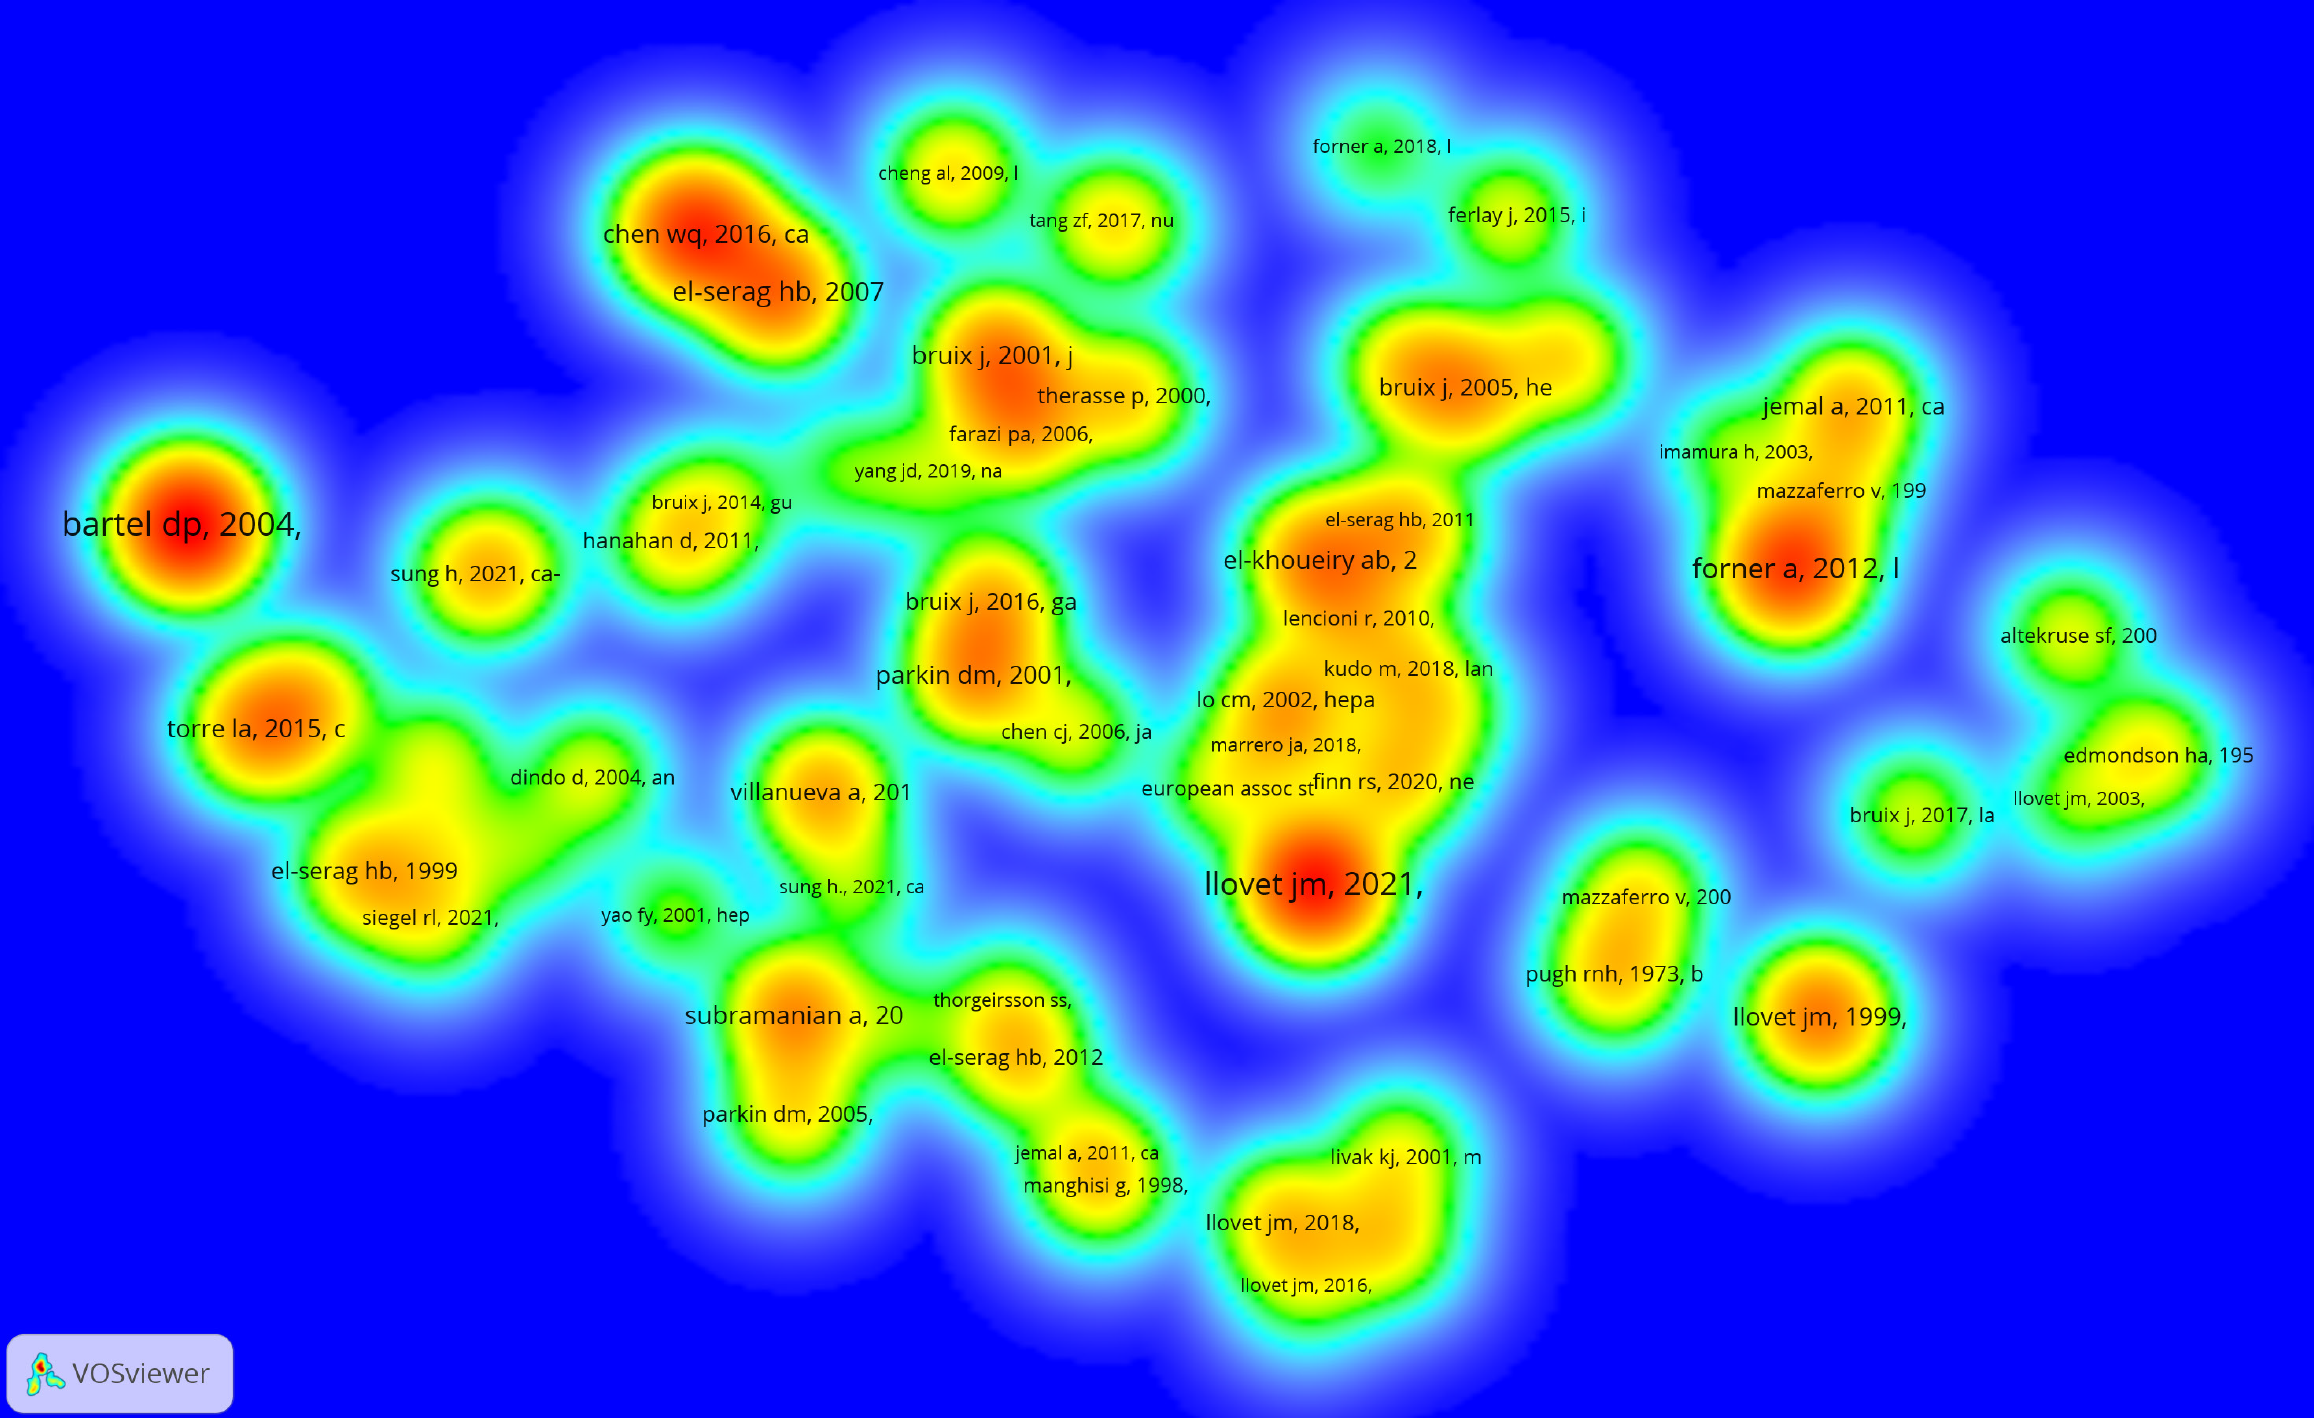
Figure 6 Density visualization map of the top 70 co-cited references on hepatocellular carcinoma.
Density visualization of the reference co-citation network. The collaborative network comprises 70 publications, with color gradients from green to red representing increasing citation frequencies from low to high.
- Citation: Shang LQ, Guo HX, Wang P, Sun XH, You JQ, Ma JT, Wang LK, Liu JX, Wang ZQ, Shao HB. Global scientific trends on hepatocellular carcinoma research from 2004 to 2023: A bibliometric and visualized analysis. World J Gastrointest Oncol 2025; 17(6): 105781
- URL: https://www.wjgnet.com/1948-5204/full/v17/i6/105781.htm
- DOI: https://dx.doi.org/10.4251/wjgo.v17.i6.105781


