Copyright
©The Author(s) 2025.
World J Gastrointest Oncol. Jun 15, 2025; 17(6): 105160
Published online Jun 15, 2025. doi: 10.4251/wjgo.v17.i6.105160
Published online Jun 15, 2025. doi: 10.4251/wjgo.v17.i6.105160
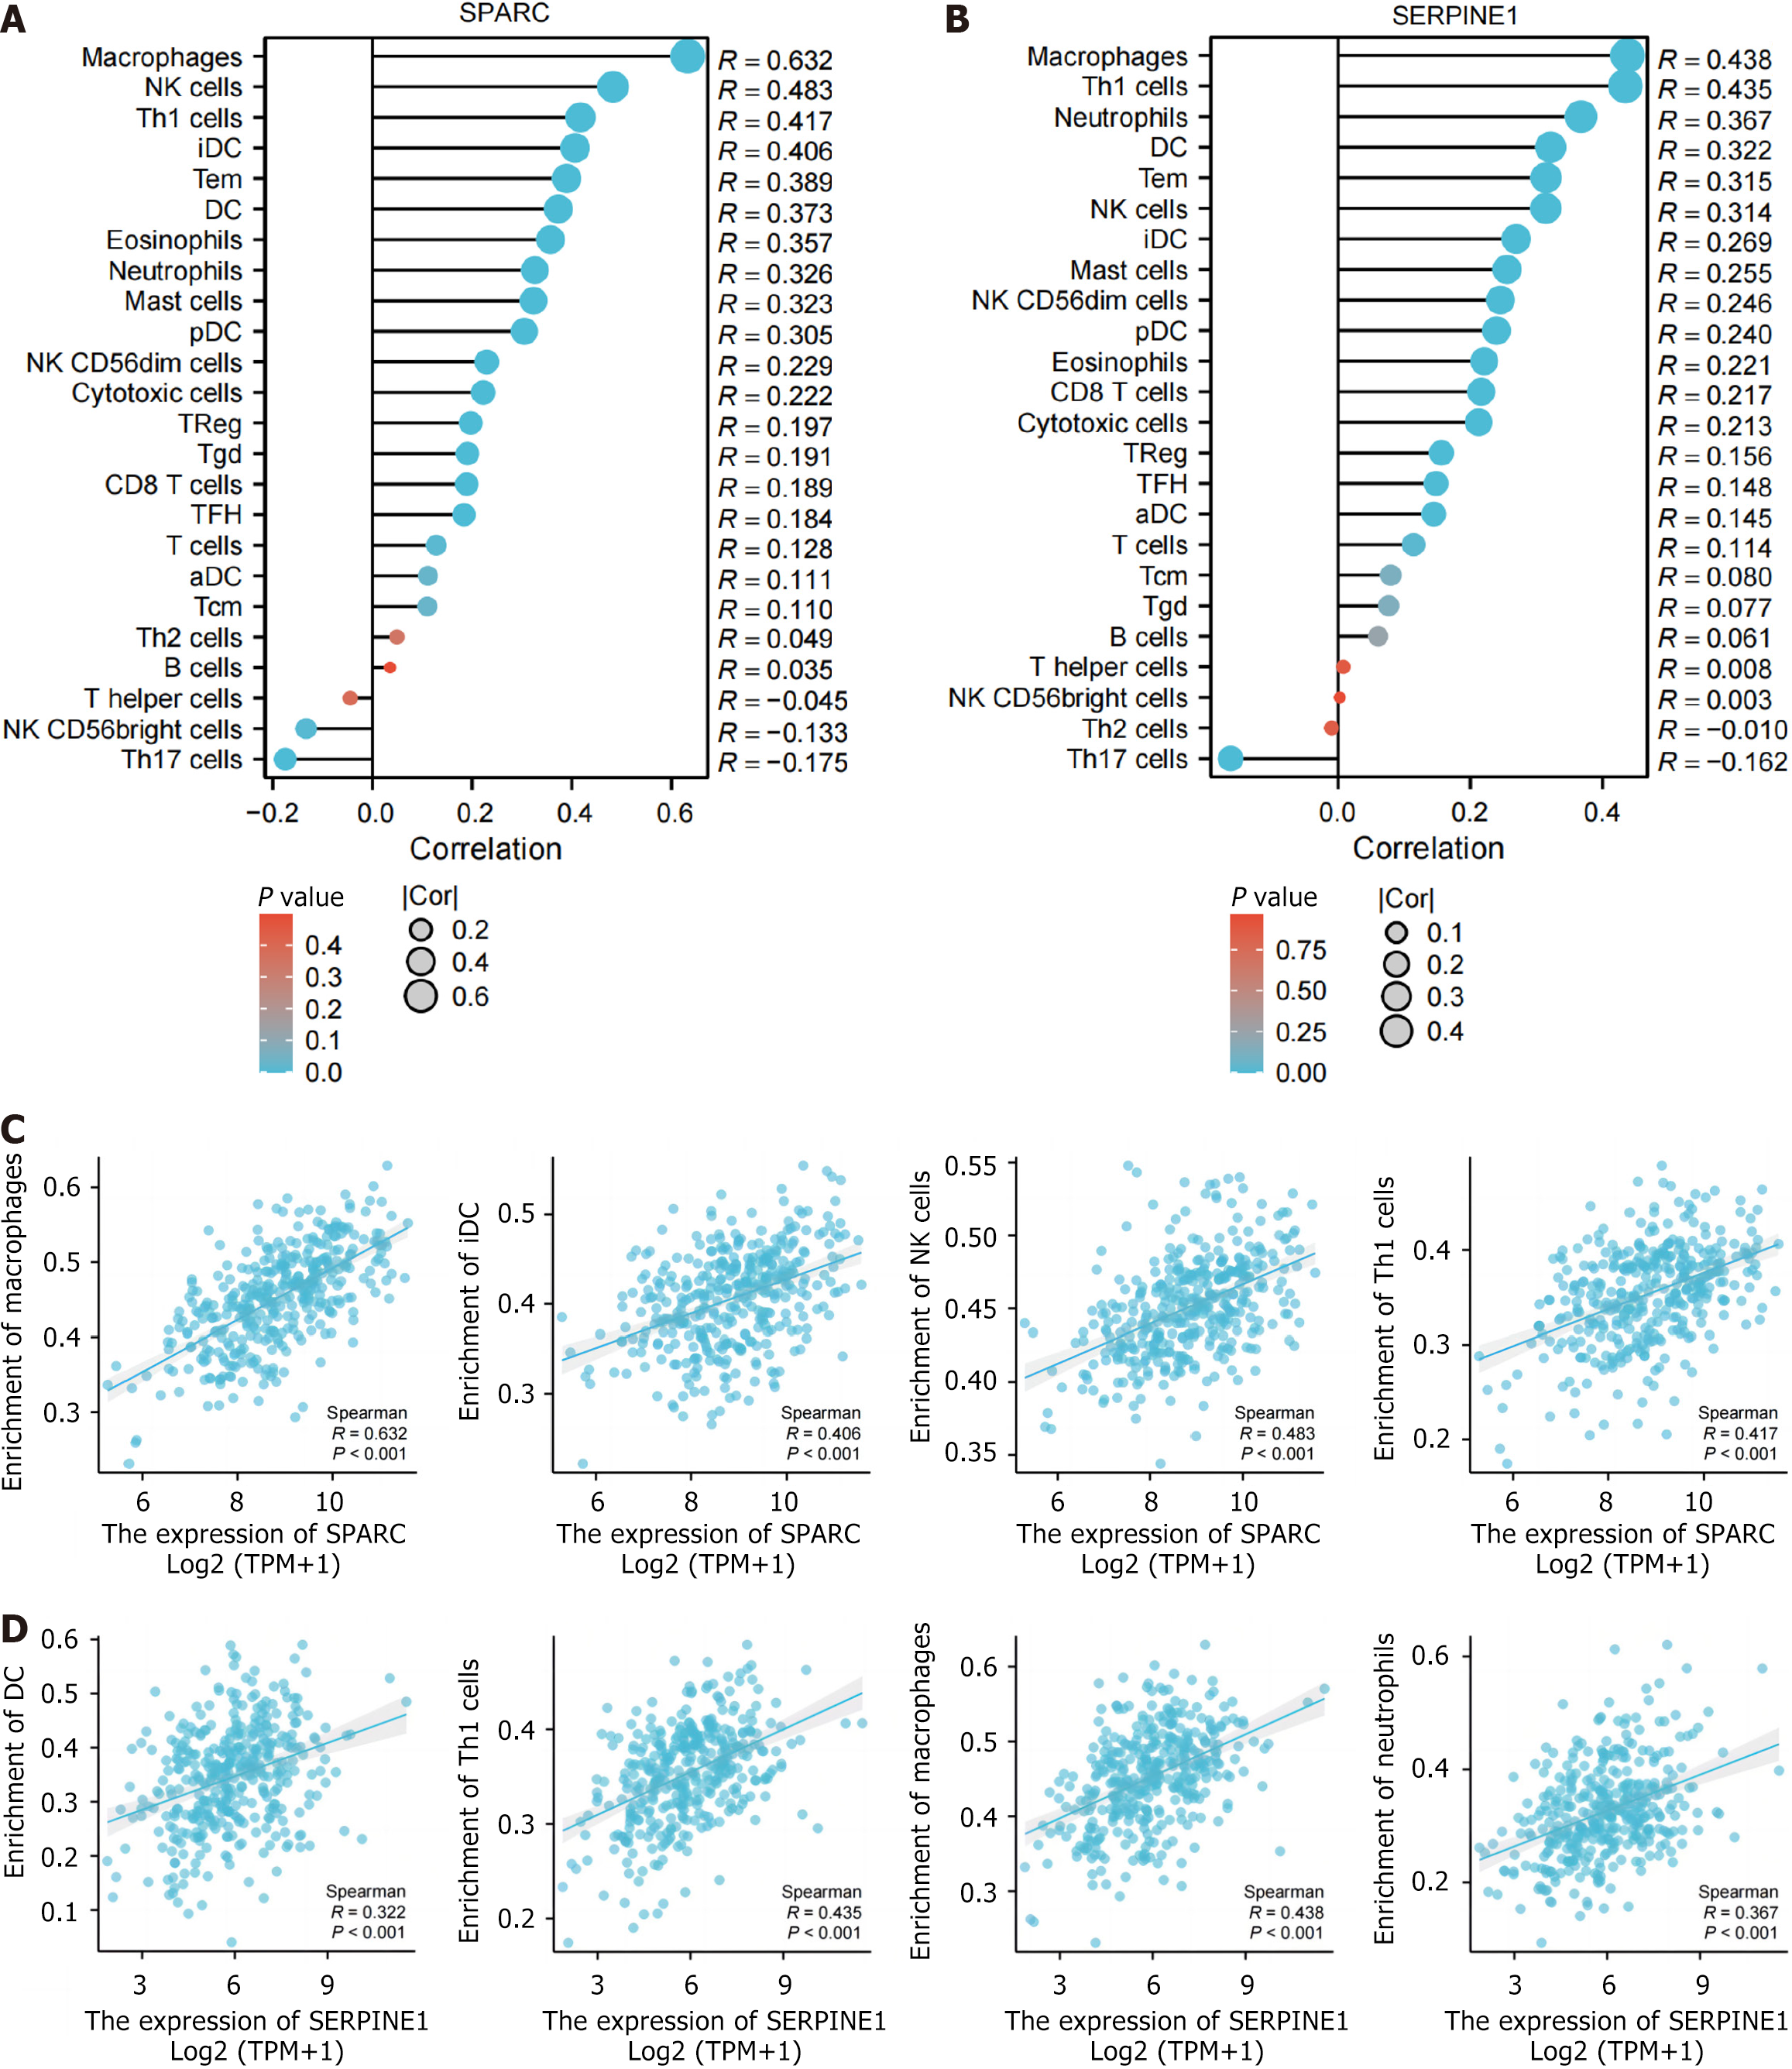
Figure 5 Secreted protein acidic and rich in cysteine/SERPINE1 immunoinfiltration analysis.
A and B: Secreted protein acidic and rich in cysteine (A) and SERPINE1 (B) in the data set the Cancer Genome Atlas (TCGA)-stomach adenocarcinoma (STAD) immune infiltration lollipop plot; C and D: Scatter plots of correlation between secreted protein acidic and rich in cysteine and major immune cells in TCGA-STAD (C) and between SERPINE1 and major immune cells in TCGA-STAD (D). NK: Natural killer; DC: Dendritic cells; iDC: Immature dendritic cells; pDC: Plasmacytoid dendritic cells; TFH: T follicular helper; aDC: Activated dendritic cells; CD: Cluster of differentiation; TPM: Transcripts per million; SPARC: Secreted protein acidic and rich in cysteine; Th: T helper cells; Treg: Regulatory T cells; Tgd: T gamma delta cells; Tcm: T central memory cells.
- Citation: Wang L, Wang MH, Yuan YH, Xu RZ, Bai L, Wang MZ. Identification and validation of extracellular matrix-related genes in the progression of gastric cancer with intestinal metaplasia. World J Gastrointest Oncol 2025; 17(6): 105160
- URL: https://www.wjgnet.com/1948-5204/full/v17/i6/105160.htm
- DOI: https://dx.doi.org/10.4251/wjgo.v17.i6.105160


