Copyright
©The Author(s) 2025.
World J Gastrointest Oncol. Jun 15, 2025; 17(6): 105160
Published online Jun 15, 2025. doi: 10.4251/wjgo.v17.i6.105160
Published online Jun 15, 2025. doi: 10.4251/wjgo.v17.i6.105160
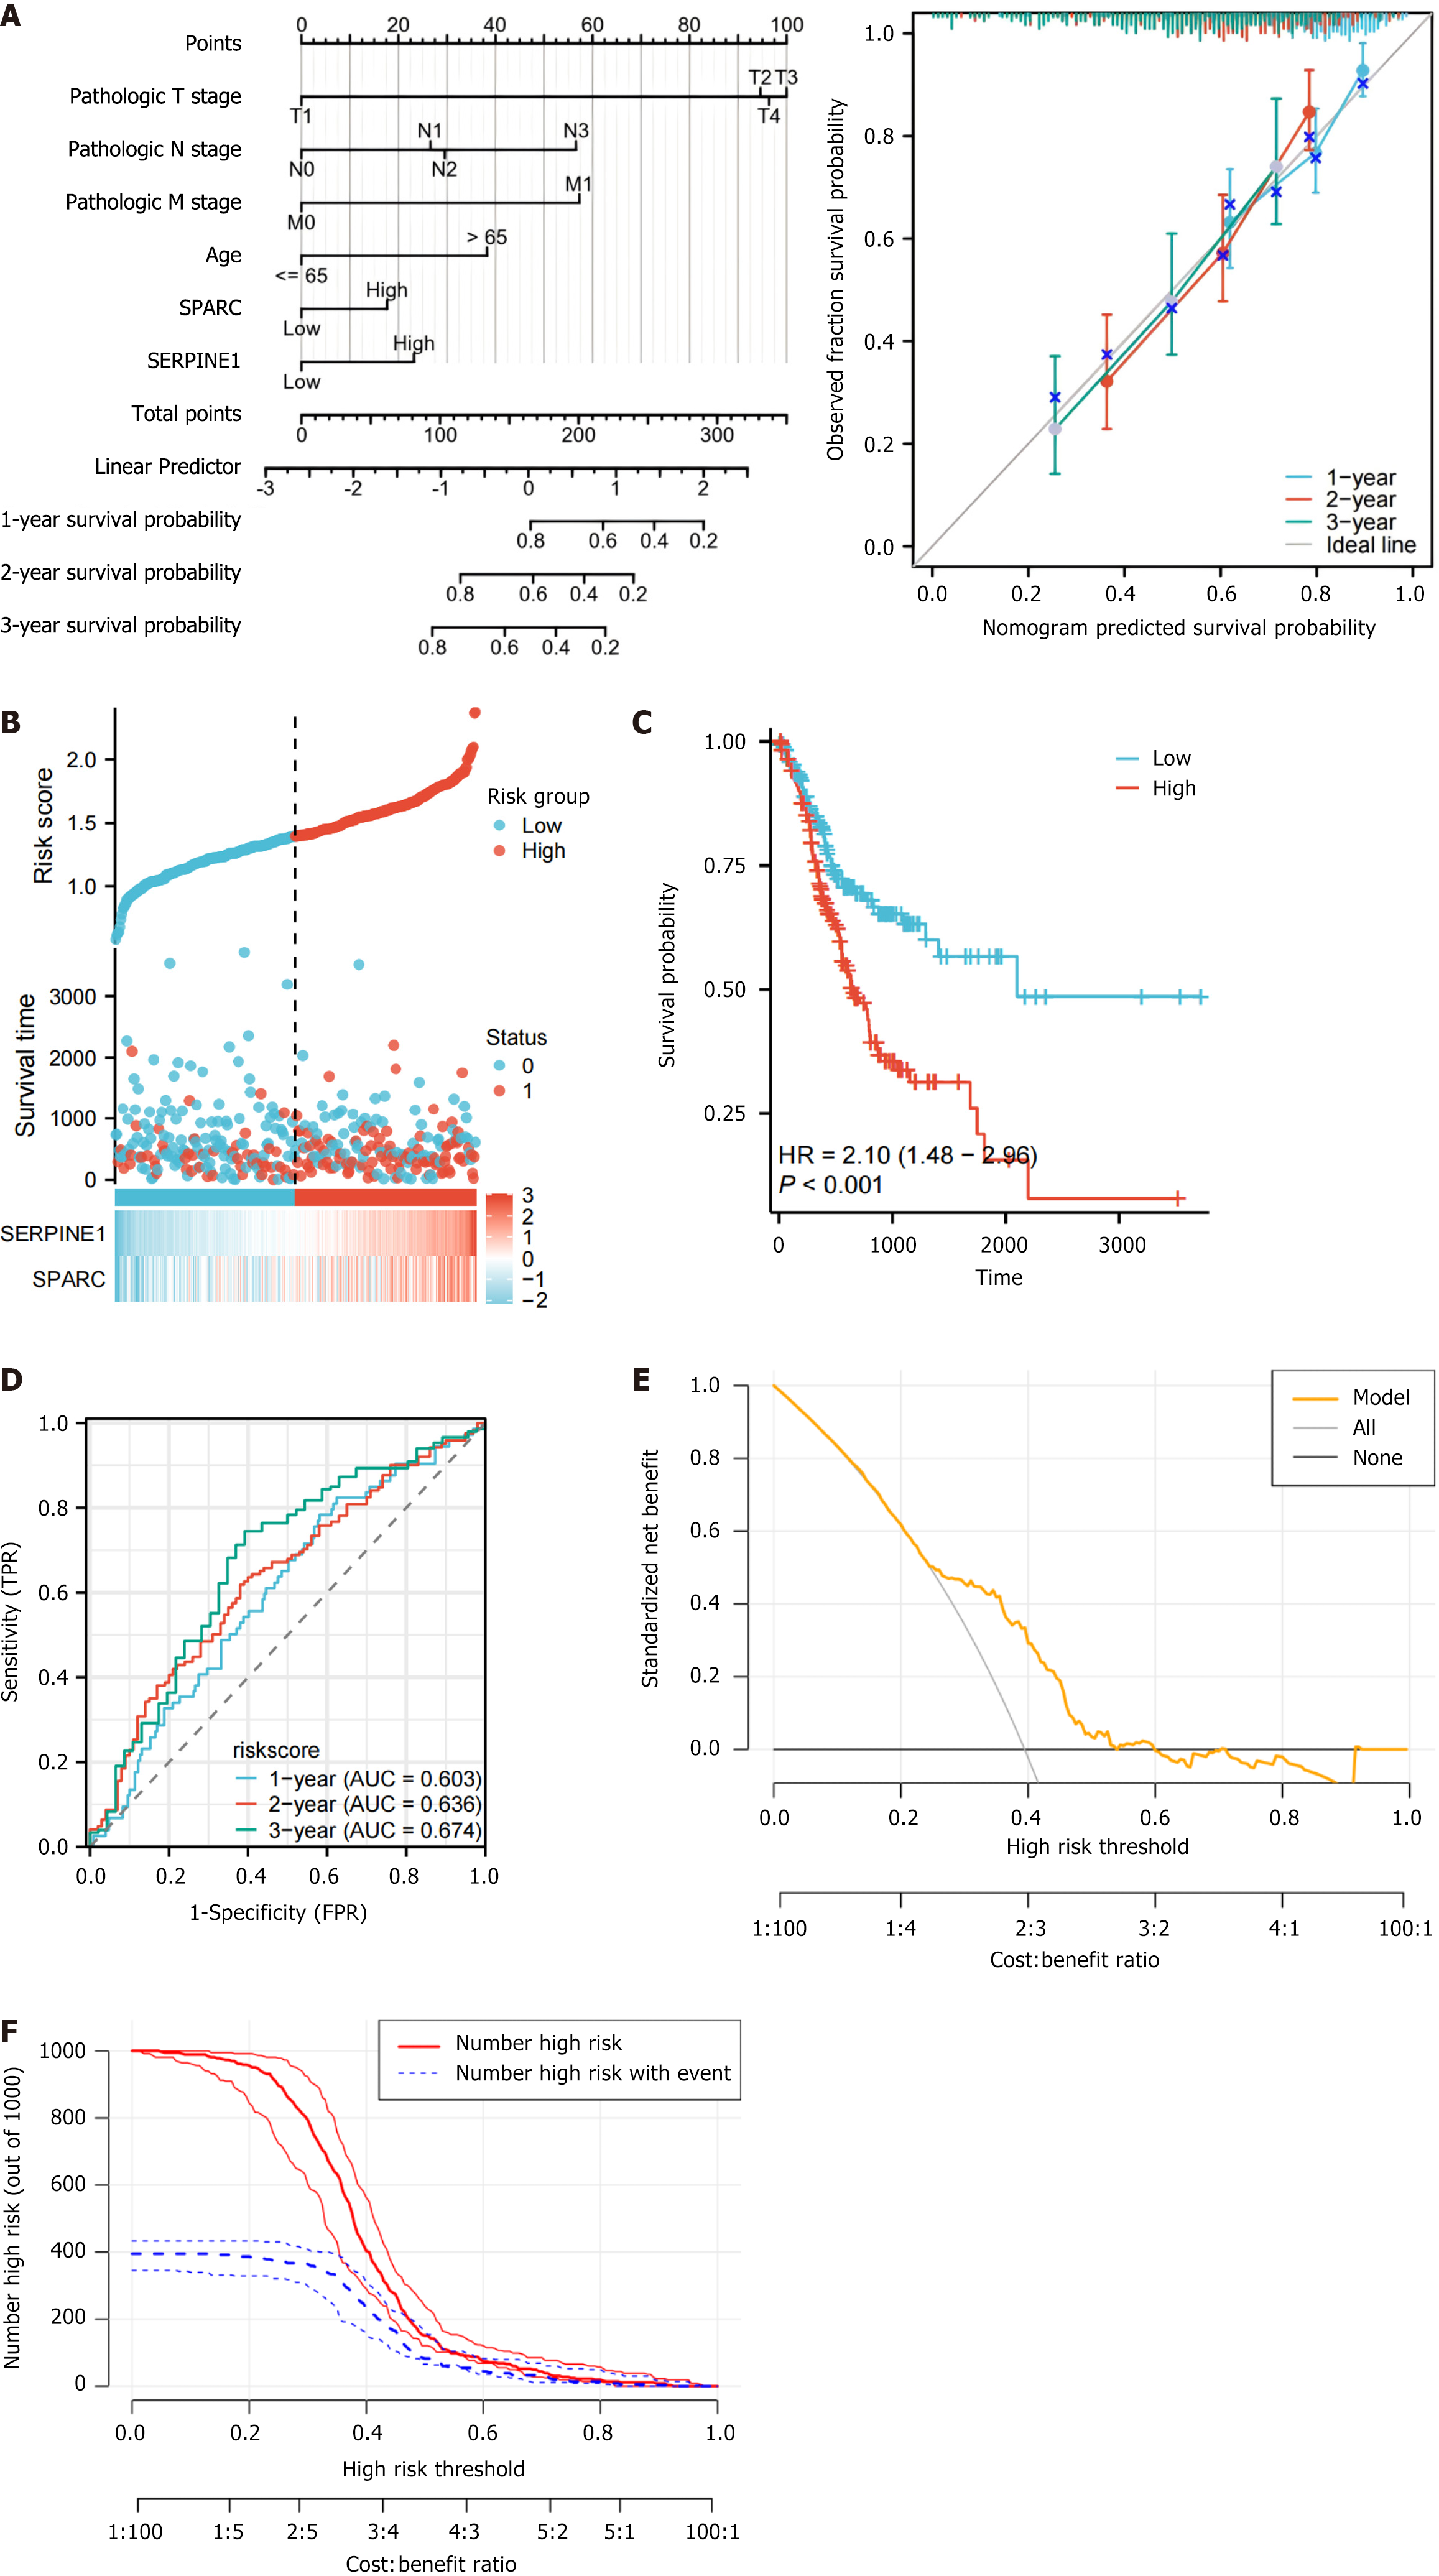
Figure 4 The establishment and validation of prognostic models.
A: Nomogram and prognostic calibration curve constructed based on clinical tumor node metastasis stage, age, and hub genes; B: Risk factor plot based on secreted protein acidic and rich in cysteine/SERPINE1 expression and risk score in the Cancer Genome Atlas-stomach adenocarcinoma dataset; C: Prognostic analysis and Kaplan-Meier curve for the two risk groups; D: Prognostic receiver operating characteristic curves at 1-year/2-year/3-year based on secreted protein acidic and rich in cysteine/SERPINE1 risk scores in the The Cancer Genome Atlas-stomach adenocarcinoma dataset; E: The decision curve analysis curve; F: The clinical impact curve. HR: Hazard ratio; TPR: True positive rate; FPR: False positive rate; AUC: Area under the curve; SPARC: Secreted protein acidic and rich in cysteine.
- Citation: Wang L, Wang MH, Yuan YH, Xu RZ, Bai L, Wang MZ. Identification and validation of extracellular matrix-related genes in the progression of gastric cancer with intestinal metaplasia. World J Gastrointest Oncol 2025; 17(6): 105160
- URL: https://www.wjgnet.com/1948-5204/full/v17/i6/105160.htm
- DOI: https://dx.doi.org/10.4251/wjgo.v17.i6.105160


