Copyright
©The Author(s) 2025.
World J Gastrointest Oncol. Jun 15, 2025; 17(6): 105160
Published online Jun 15, 2025. doi: 10.4251/wjgo.v17.i6.105160
Published online Jun 15, 2025. doi: 10.4251/wjgo.v17.i6.105160
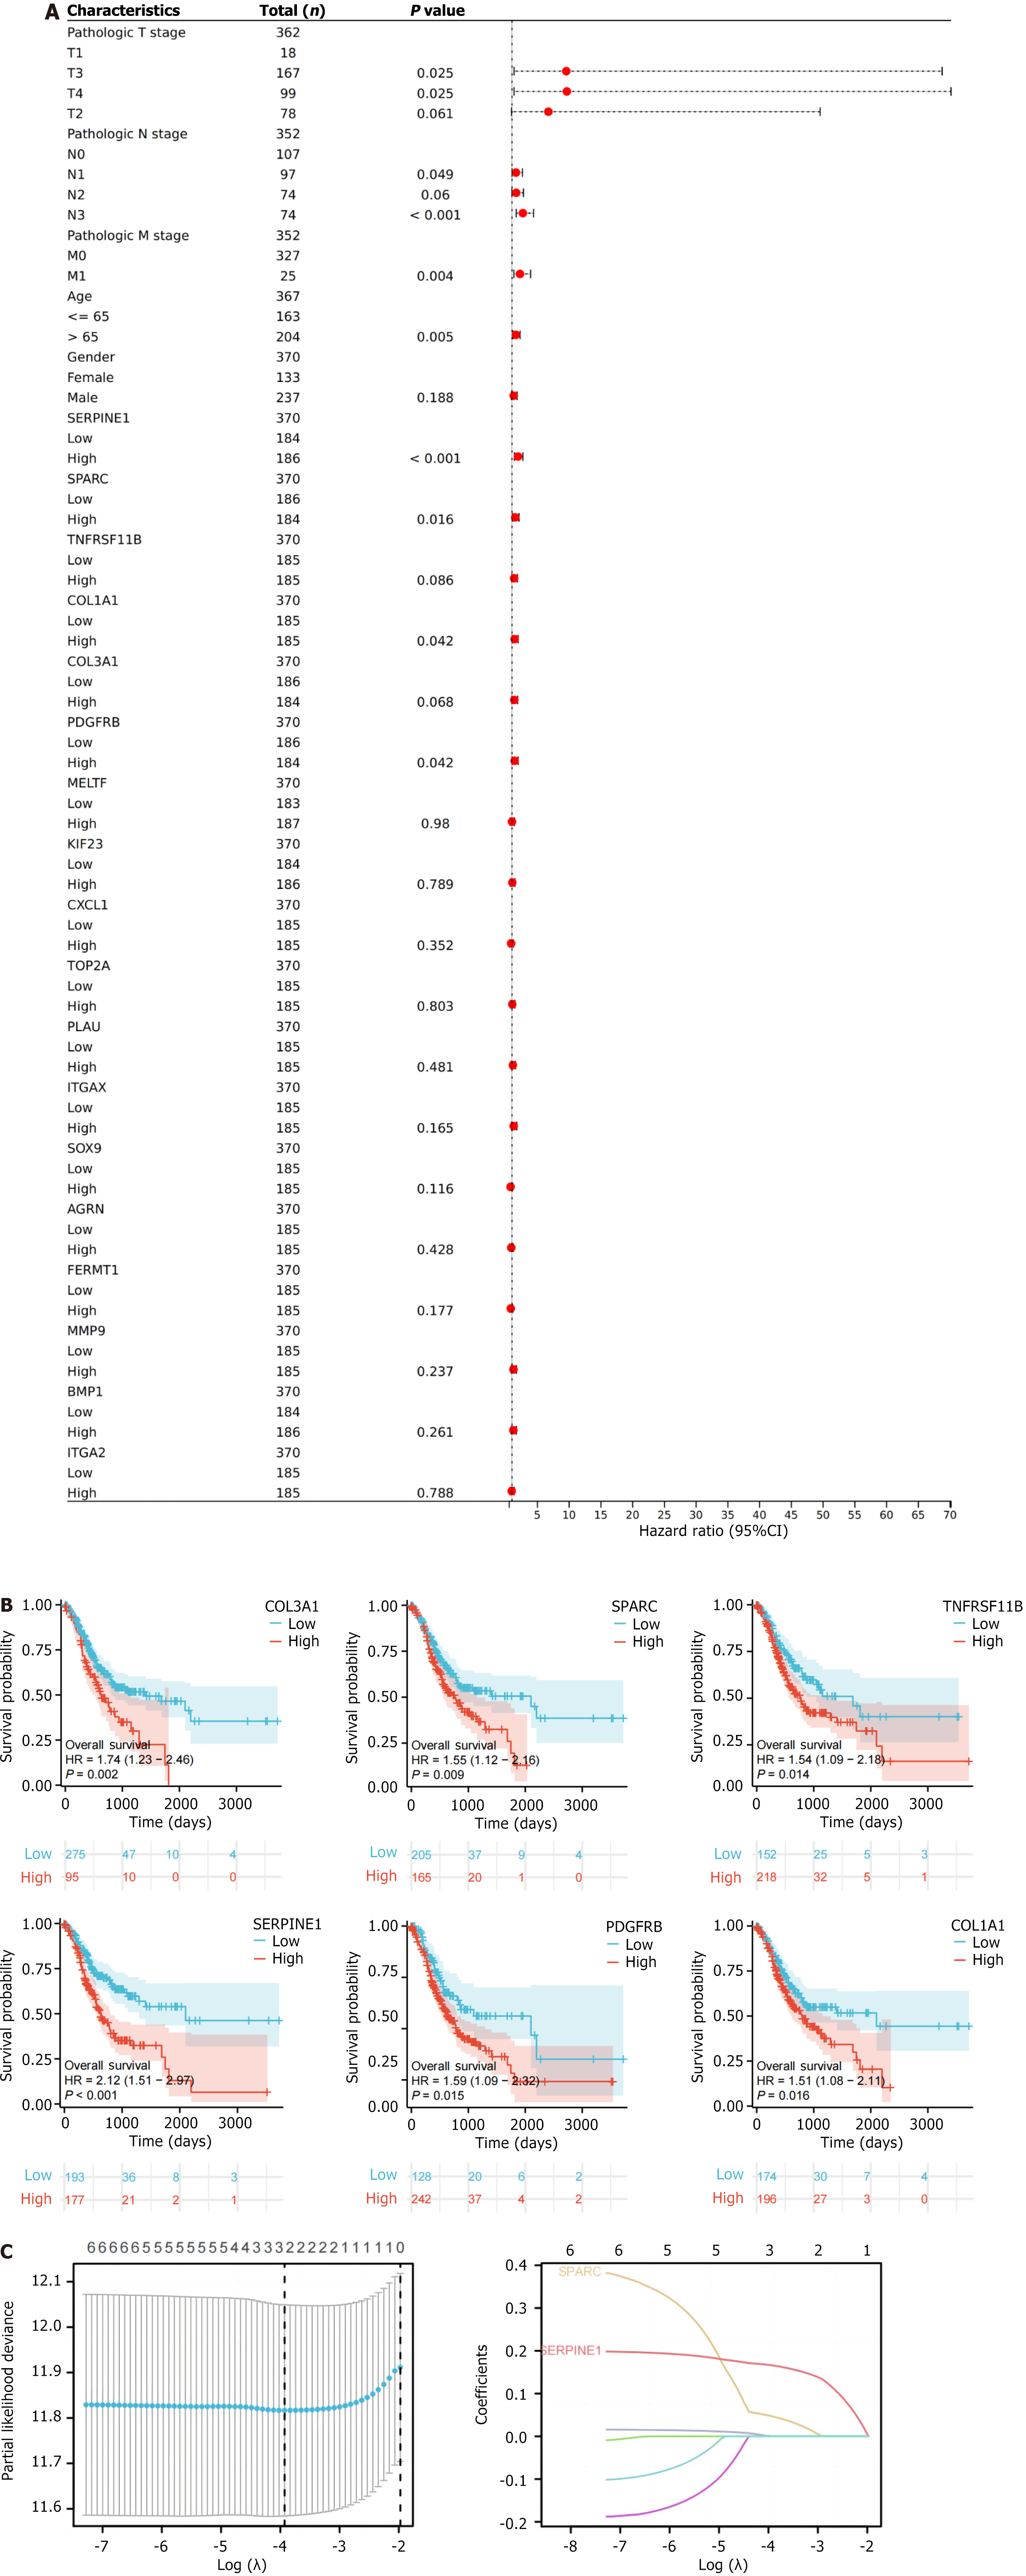
Figure 3 Prognostic analysis of intersecting genes and model establishment.
A: Forest plot of univariate regression analysis for 18 genes in The Cancer Genome Atlas-stomach adenocarcinoma dataset; B: Kaplan-Meier curve plot of six genes exhibiting an obvious relevance to overall survival; C: Least absolute shrinkage and selection operator analysis of six genes based on prognostic information from The Cancer Genome Atlas-colon adenocarcinoma. HR: Hazard ratio; CI: Confidence interval; SPARC: Secreted protein acidic and rich in cysteine.
- Citation: Wang L, Wang MH, Yuan YH, Xu RZ, Bai L, Wang MZ. Identification and validation of extracellular matrix-related genes in the progression of gastric cancer with intestinal metaplasia. World J Gastrointest Oncol 2025; 17(6): 105160
- URL: https://www.wjgnet.com/1948-5204/full/v17/i6/105160.htm
- DOI: https://dx.doi.org/10.4251/wjgo.v17.i6.105160


