Copyright
©The Author(s) 2025.
World J Gastrointest Oncol. Jun 15, 2025; 17(6): 105160
Published online Jun 15, 2025. doi: 10.4251/wjgo.v17.i6.105160
Published online Jun 15, 2025. doi: 10.4251/wjgo.v17.i6.105160
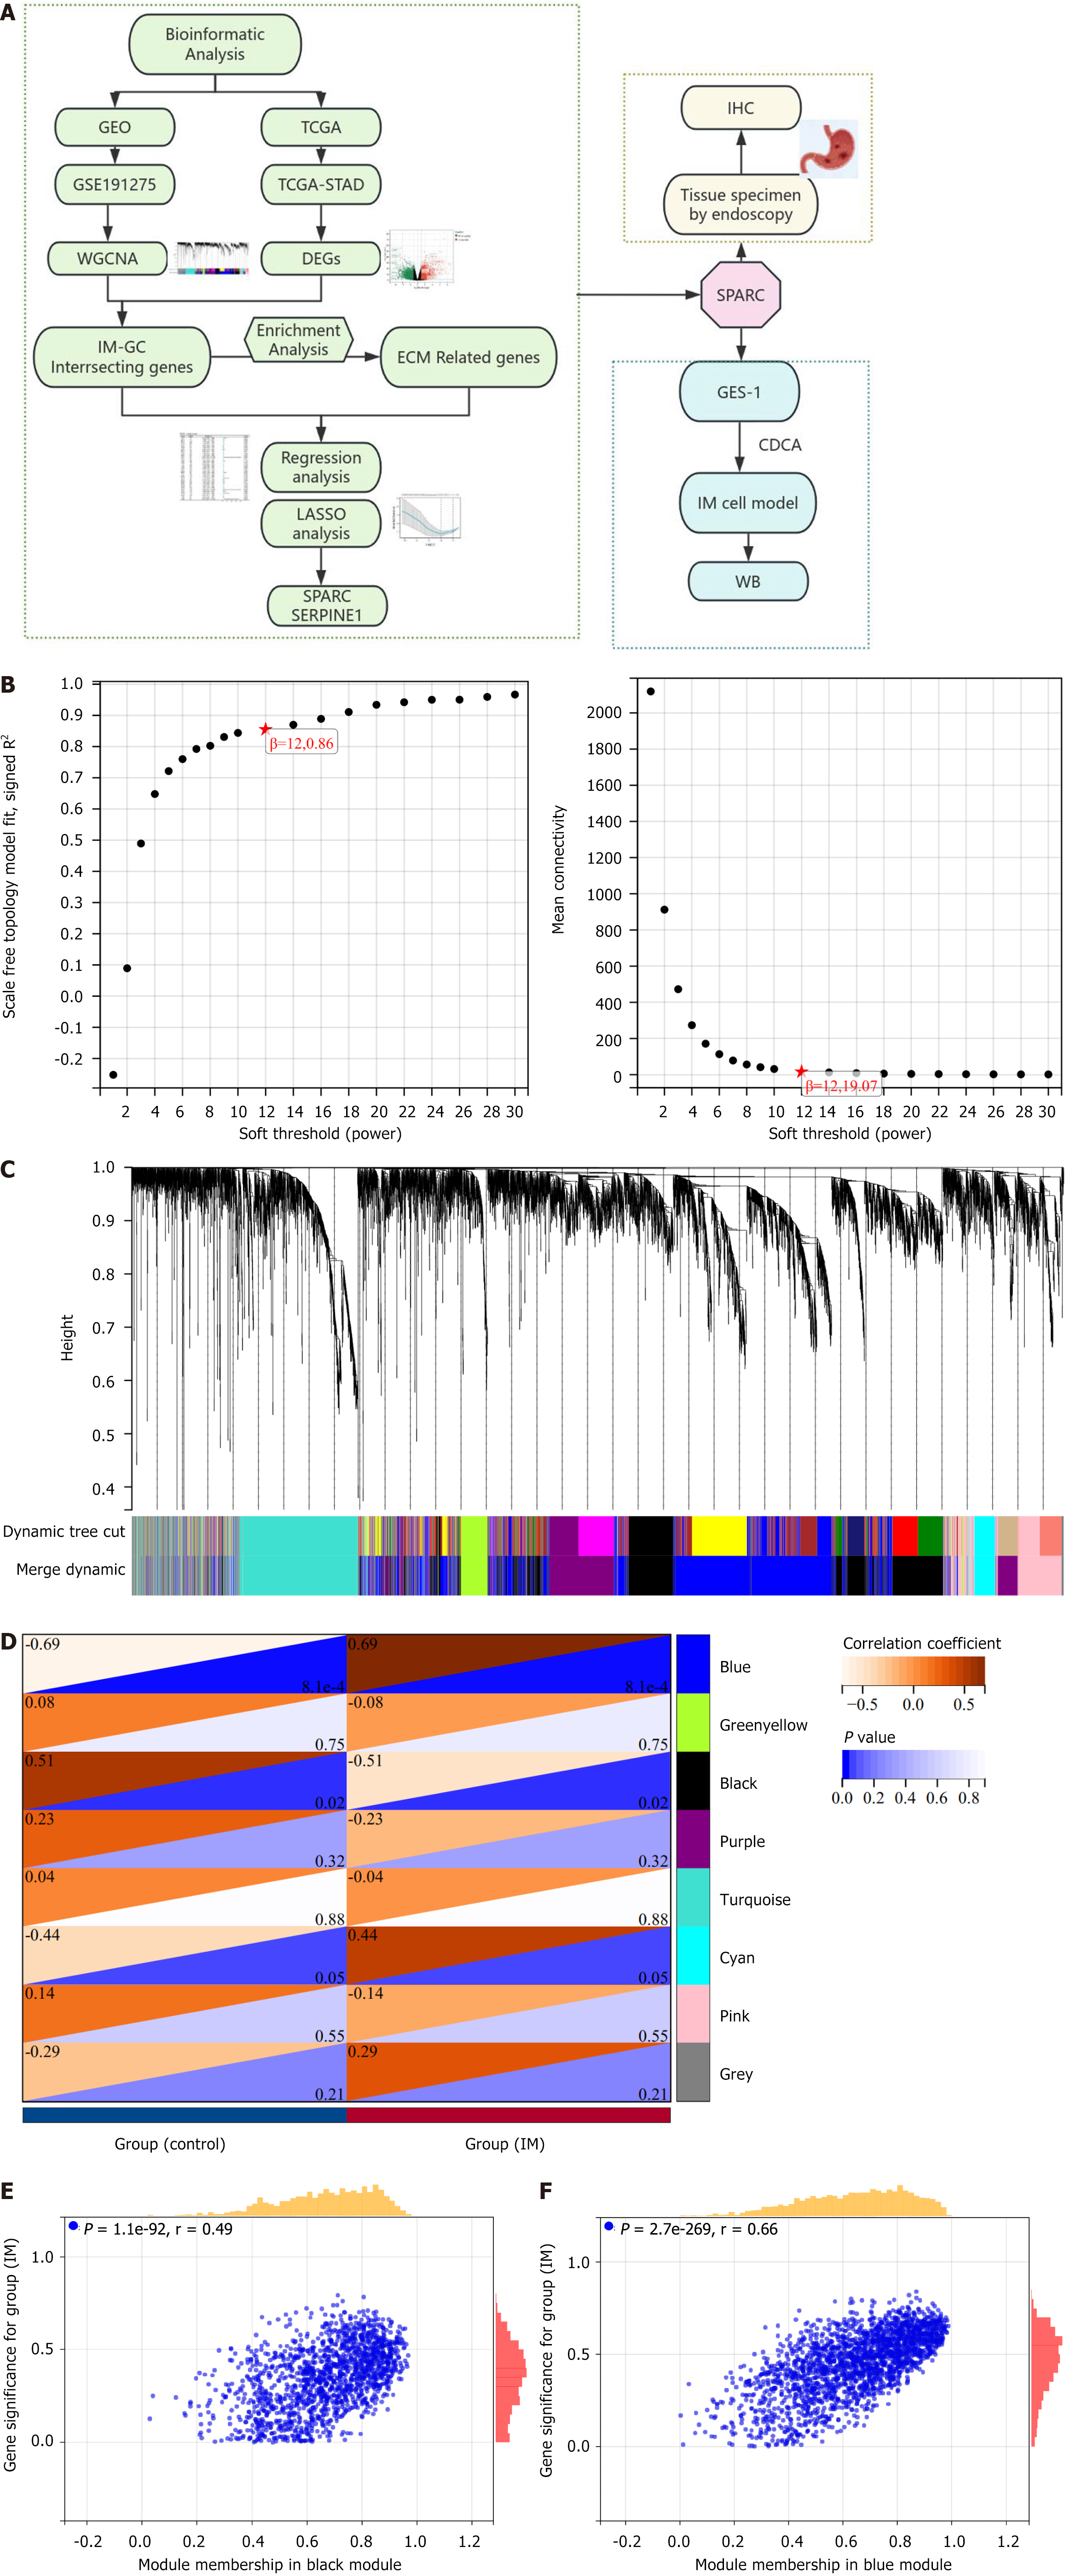
Figure 1 Flowchart and weighted gene co-expression network analysis.
A: Flowchart of research; B: The optimal β soft threshold was determined as 12 through scale-free topology and average connectivity analysis; C: Cluster analysis of characteristic gene modules resulted in the identification of eight modules; D-F: Heatmaps showed the correlation between phenotypes and characteristic gene modules confirmed black membership and blue membership as hub modules. GEO: Gene Expression Omnibus; TCGA: The Cancer Genome Atlas; STAD: Stomach adenocarcinoma; IM: Intestinal metaplasia; GC: Gastric cancer; ECM: Extracellular matrix; LASSO: Least absolute shrinkage and selection operator; WGCNA: Weighted gene co-expression network analysis; DEGs: Differentially expressed genes; CDCA: Chenodeoxycholic acid; WB: Western blot; IHC: Immunohistochemistry; SPARC: Secreted protein acidic and rich in cysteine.
- Citation: Wang L, Wang MH, Yuan YH, Xu RZ, Bai L, Wang MZ. Identification and validation of extracellular matrix-related genes in the progression of gastric cancer with intestinal metaplasia. World J Gastrointest Oncol 2025; 17(6): 105160
- URL: https://www.wjgnet.com/1948-5204/full/v17/i6/105160.htm
- DOI: https://dx.doi.org/10.4251/wjgo.v17.i6.105160


