Copyright
©The Author(s) 2025.
World J Gastrointest Oncol. May 15, 2025; 17(5): 105027
Published online May 15, 2025. doi: 10.4251/wjgo.v17.i5.105027
Published online May 15, 2025. doi: 10.4251/wjgo.v17.i5.105027
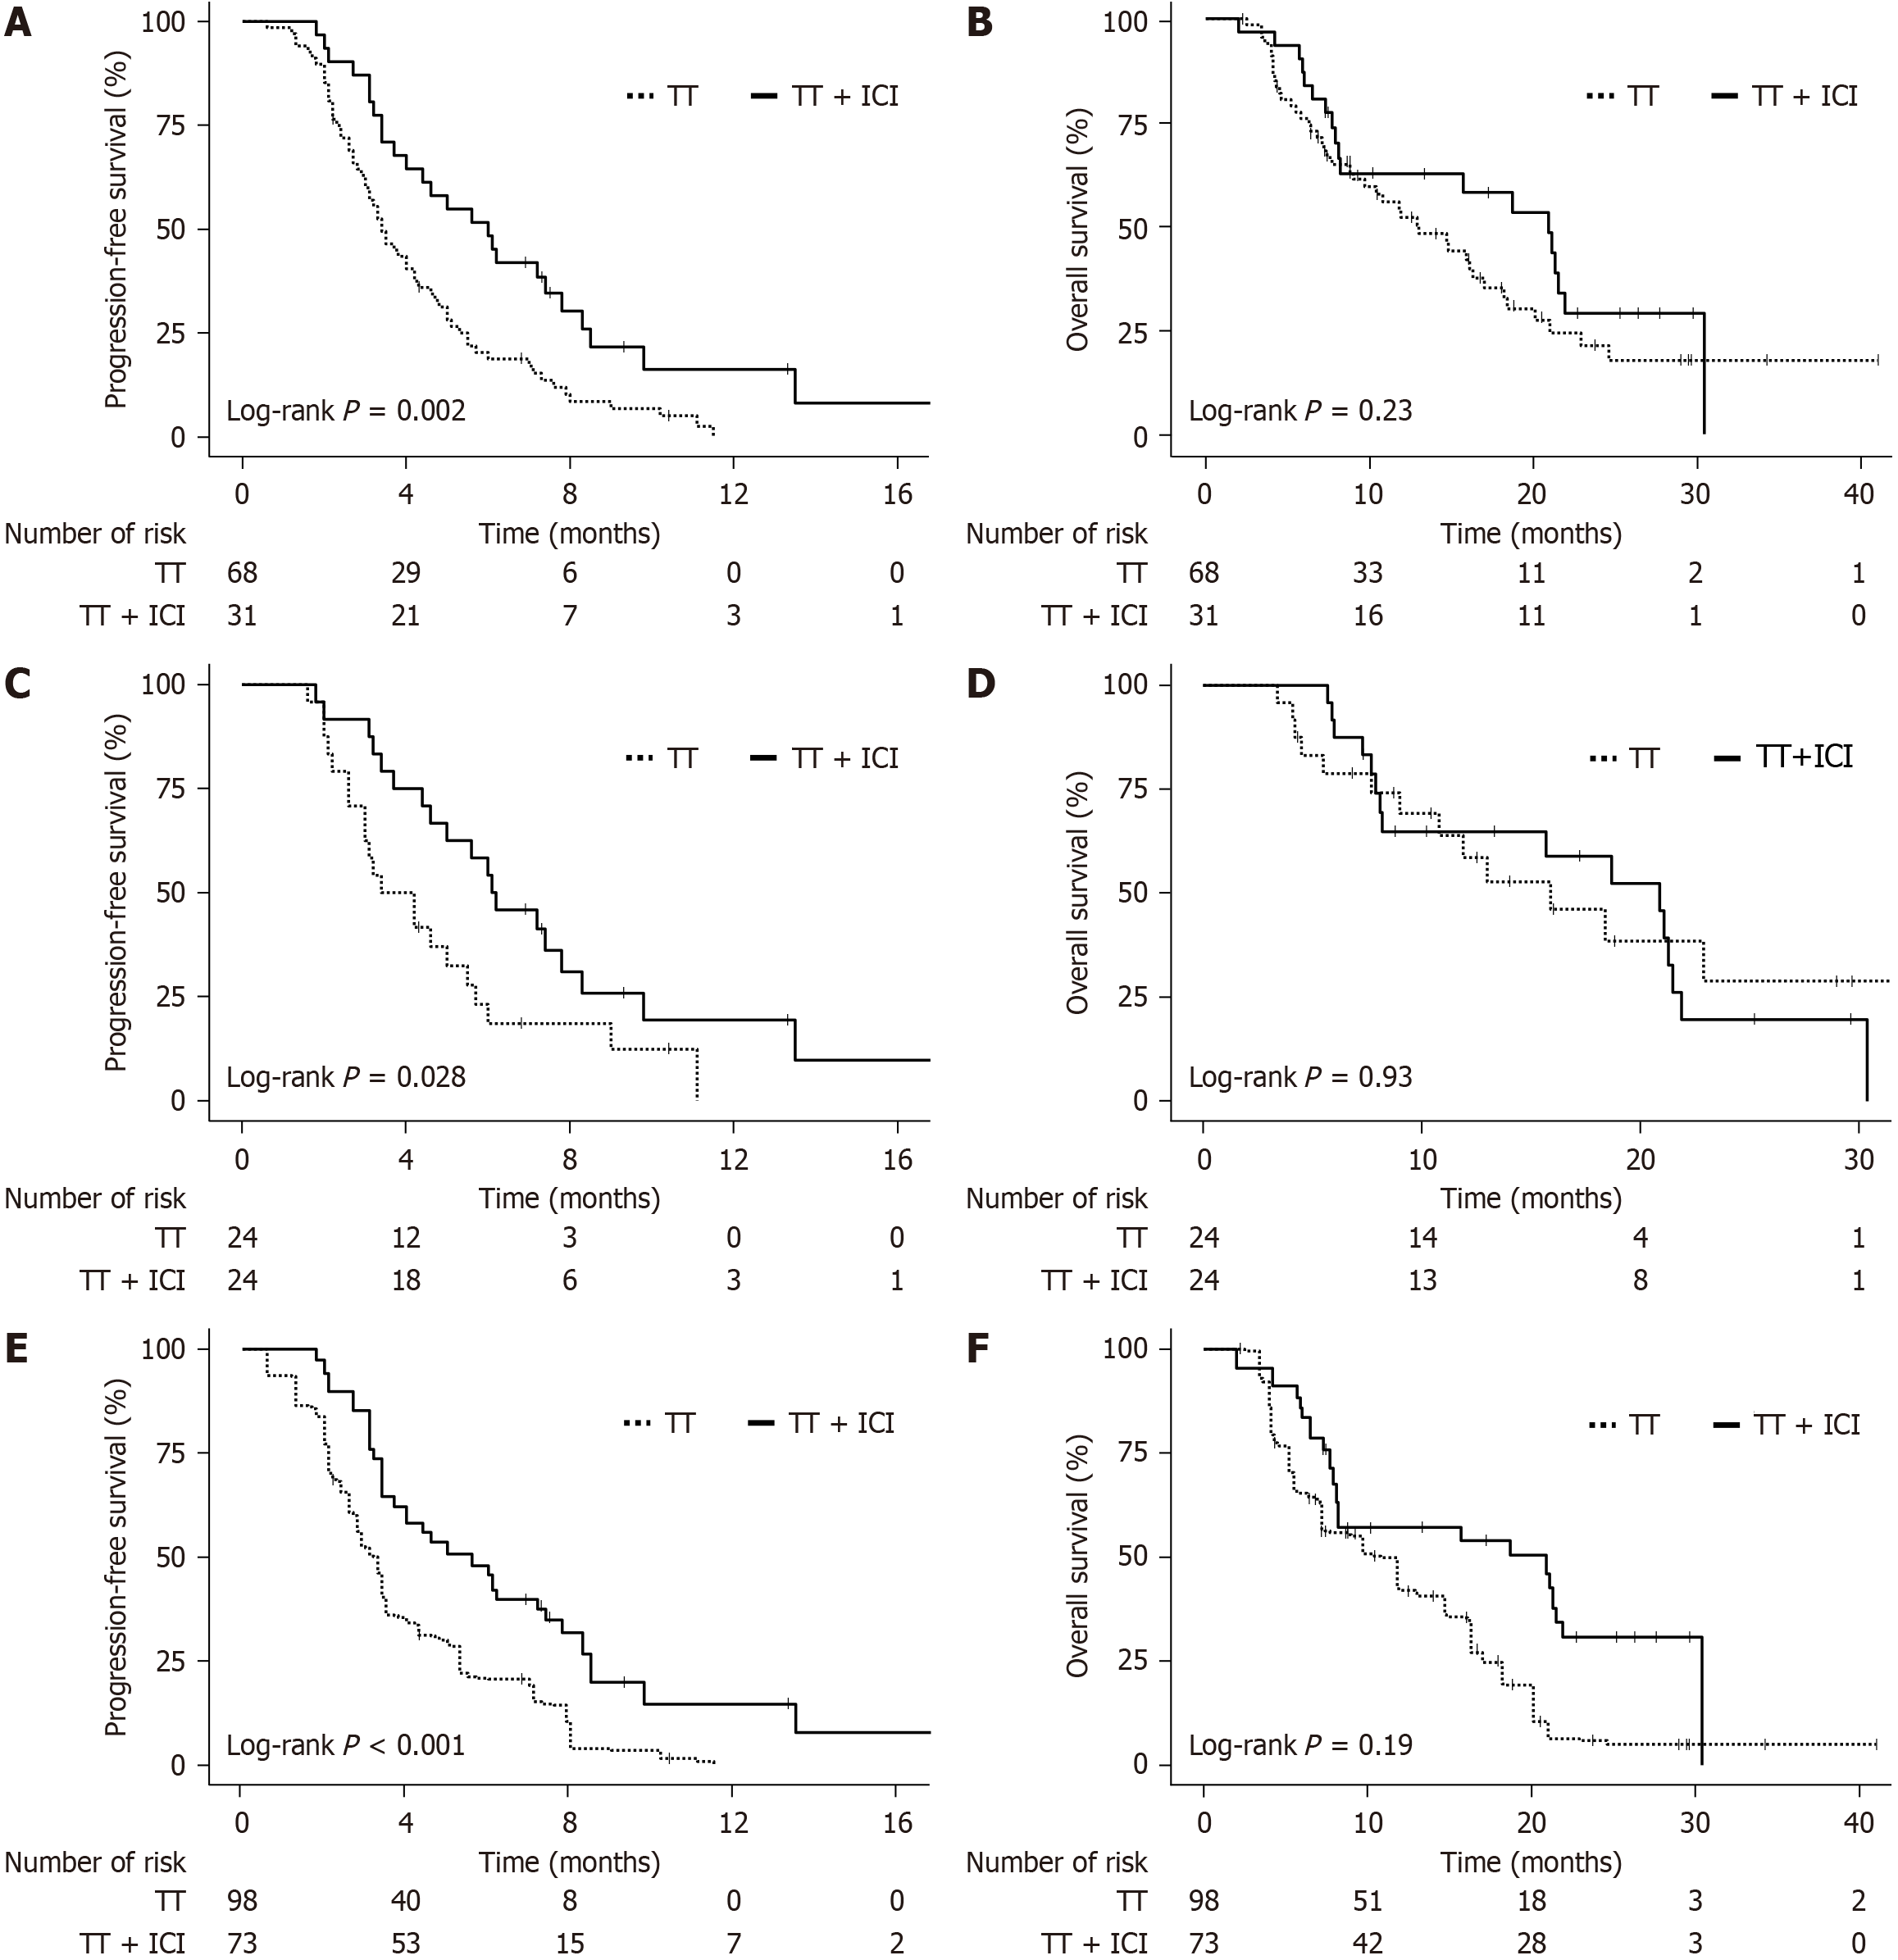
Figure 2 Kaplan-Meier survival curves comparing targeted therapy and targeted therapy + immune checkpoint inhibitor (targeted therapy combined with immune checkpoint inhibitors).
A and B: Original data: Progression-free survival (PFS; A) and overall survival (OS; B); C and D: Propensity score matching: PFS (C) and OS (D); E and F: Inverse probability weighting: PFS (E) and OS (F). Log-rank test P values are indicated on each panel. The number at risk at different time points is shown below the X-axis. TT: Targeted therapy; ICI: Immune checkpoint inhibitor.
- Citation: Wang PJ, Wang J, Yao XM, Cheng WL, Sun L, Yan J, Yu YL, Li SY, Li DP, Jia JH. Evaluation of efficacy and safety of targeted therapy and immune checkpoint inhibitors in metastatic colorectal cancer. World J Gastrointest Oncol 2025; 17(5): 105027
- URL: https://www.wjgnet.com/1948-5204/full/v17/i5/105027.htm
- DOI: https://dx.doi.org/10.4251/wjgo.v17.i5.105027


