Copyright
©The Author(s) 2025.
World J Gastrointest Oncol. May 15, 2025; 17(5): 104776
Published online May 15, 2025. doi: 10.4251/wjgo.v17.i5.104776
Published online May 15, 2025. doi: 10.4251/wjgo.v17.i5.104776
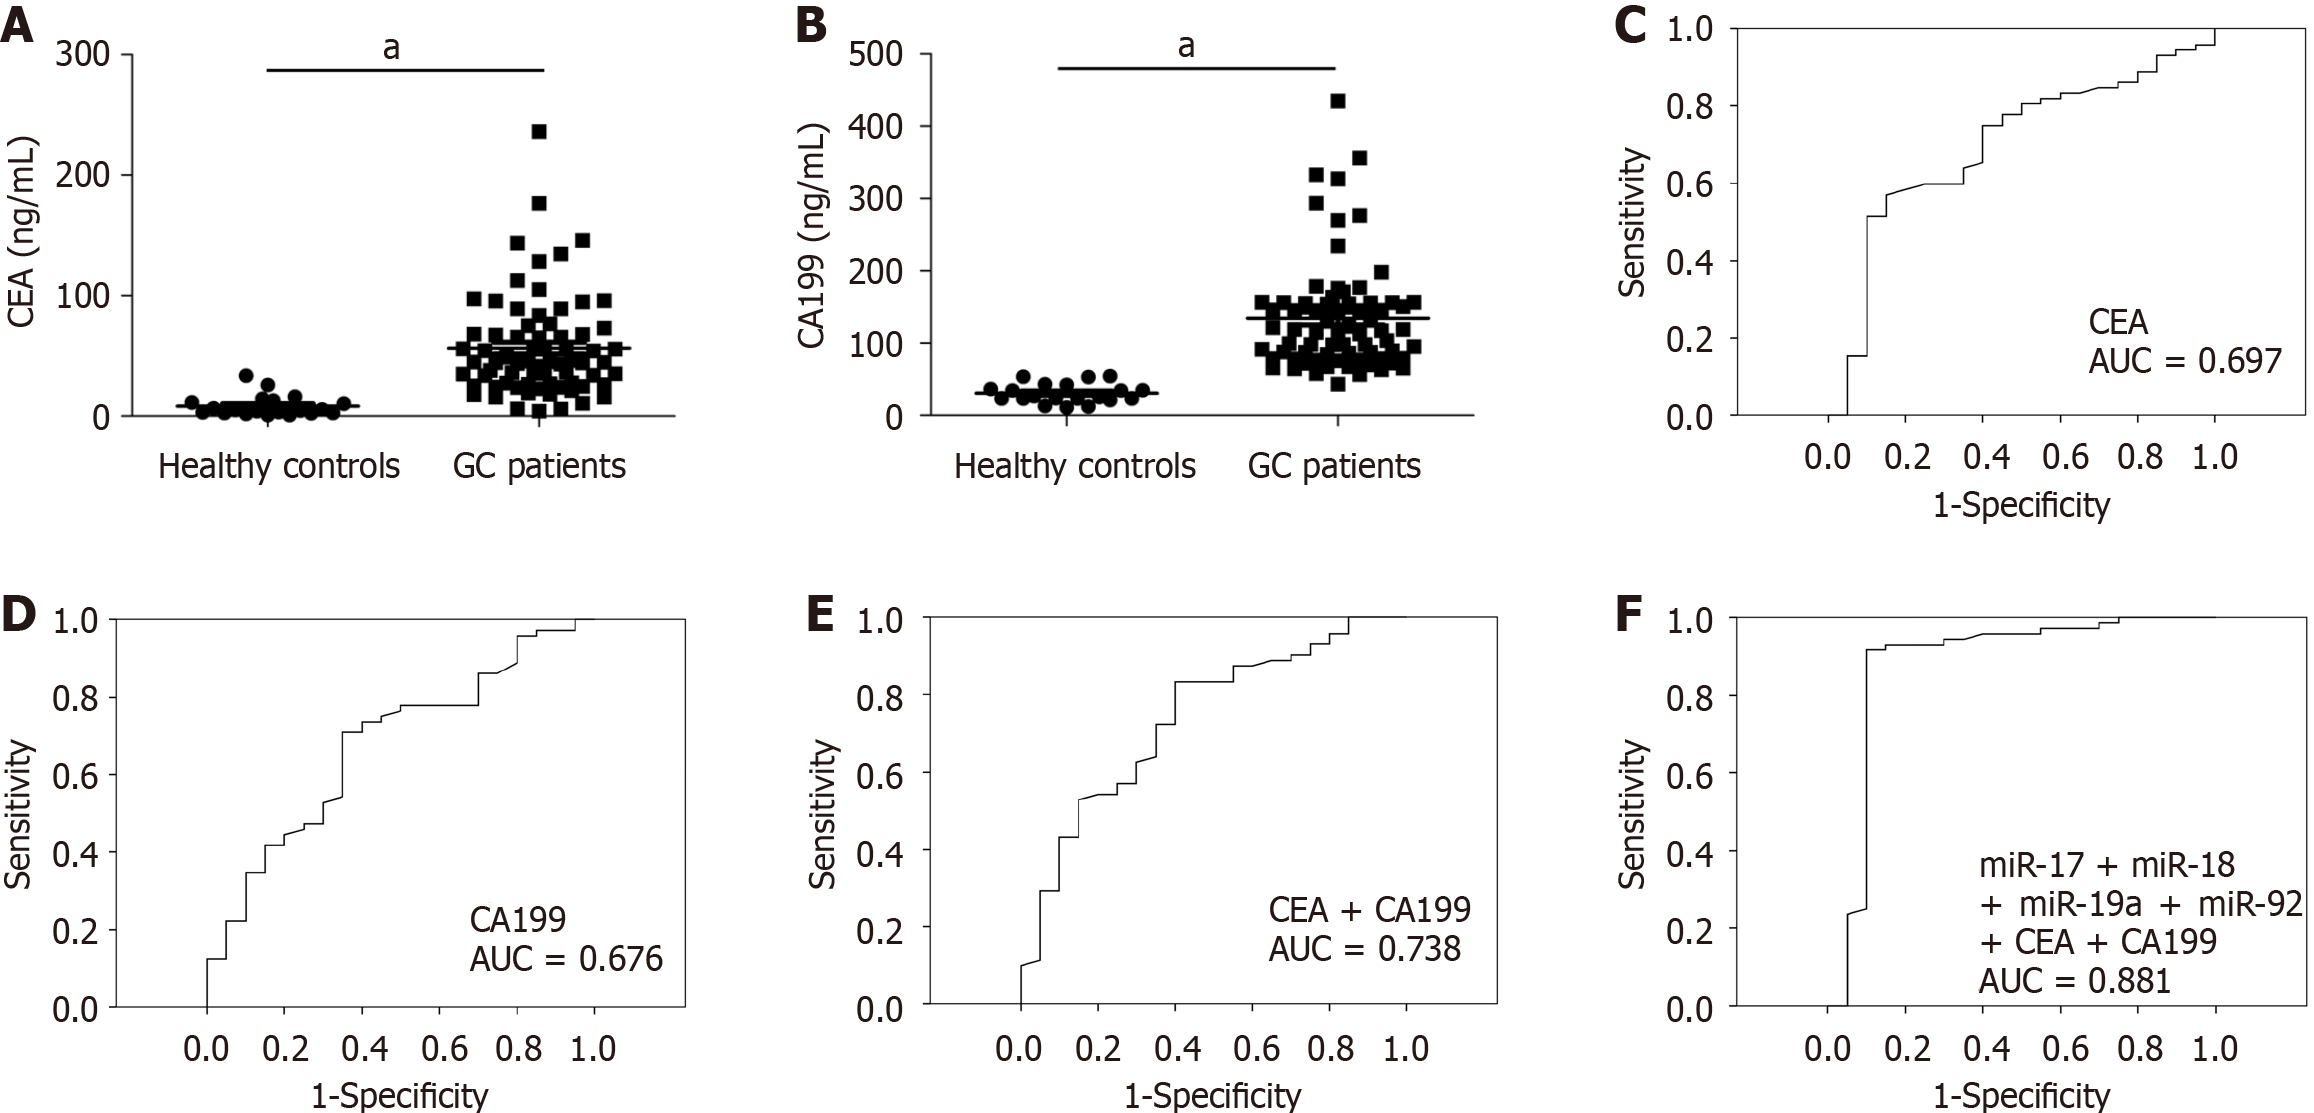
Figure 4 Expression levels of carcinoembryonic antigen and carbohydrate antigen 19-9 in serum samples of patients with gastric cancer and healthy controls and their clinical diagnostic values alone or with serum exosomal miRNAs.
A: Expression level of carcinoembryonic antigen (CEA); B: Expression level of carbohydrate antigen 19-9 (CA19-9); C: Receiver operating characteristic curve (ROC) curve for CEA; D: ROC curve for CA19-9; E: ROC curve for CEA + CA19-9; F: ROC curve for miR-17 + miR-18 + miR-19a + miR-92 + CEA + CA19-9. aP < 0.05; AUC: The area under the curve; CEA: Carcinoembryonic antigen; CA19-9: Carbohydrate antigen 19-9.
- Citation: Han Y, Guo XP, Zhi QM, Xu JJ, Liu F, Kuang YT. Circulating exosomal miR-17-92 cluster serves as a novel noninvasive diagnostic marker for patients with gastric cancer. World J Gastrointest Oncol 2025; 17(5): 104776
- URL: https://www.wjgnet.com/1948-5204/full/v17/i5/104776.htm
- DOI: https://dx.doi.org/10.4251/wjgo.v17.i5.104776


