Copyright
©The Author(s) 2025.
World J Gastrointest Oncol. May 15, 2025; 17(5): 104591
Published online May 15, 2025. doi: 10.4251/wjgo.v17.i5.104591
Published online May 15, 2025. doi: 10.4251/wjgo.v17.i5.104591
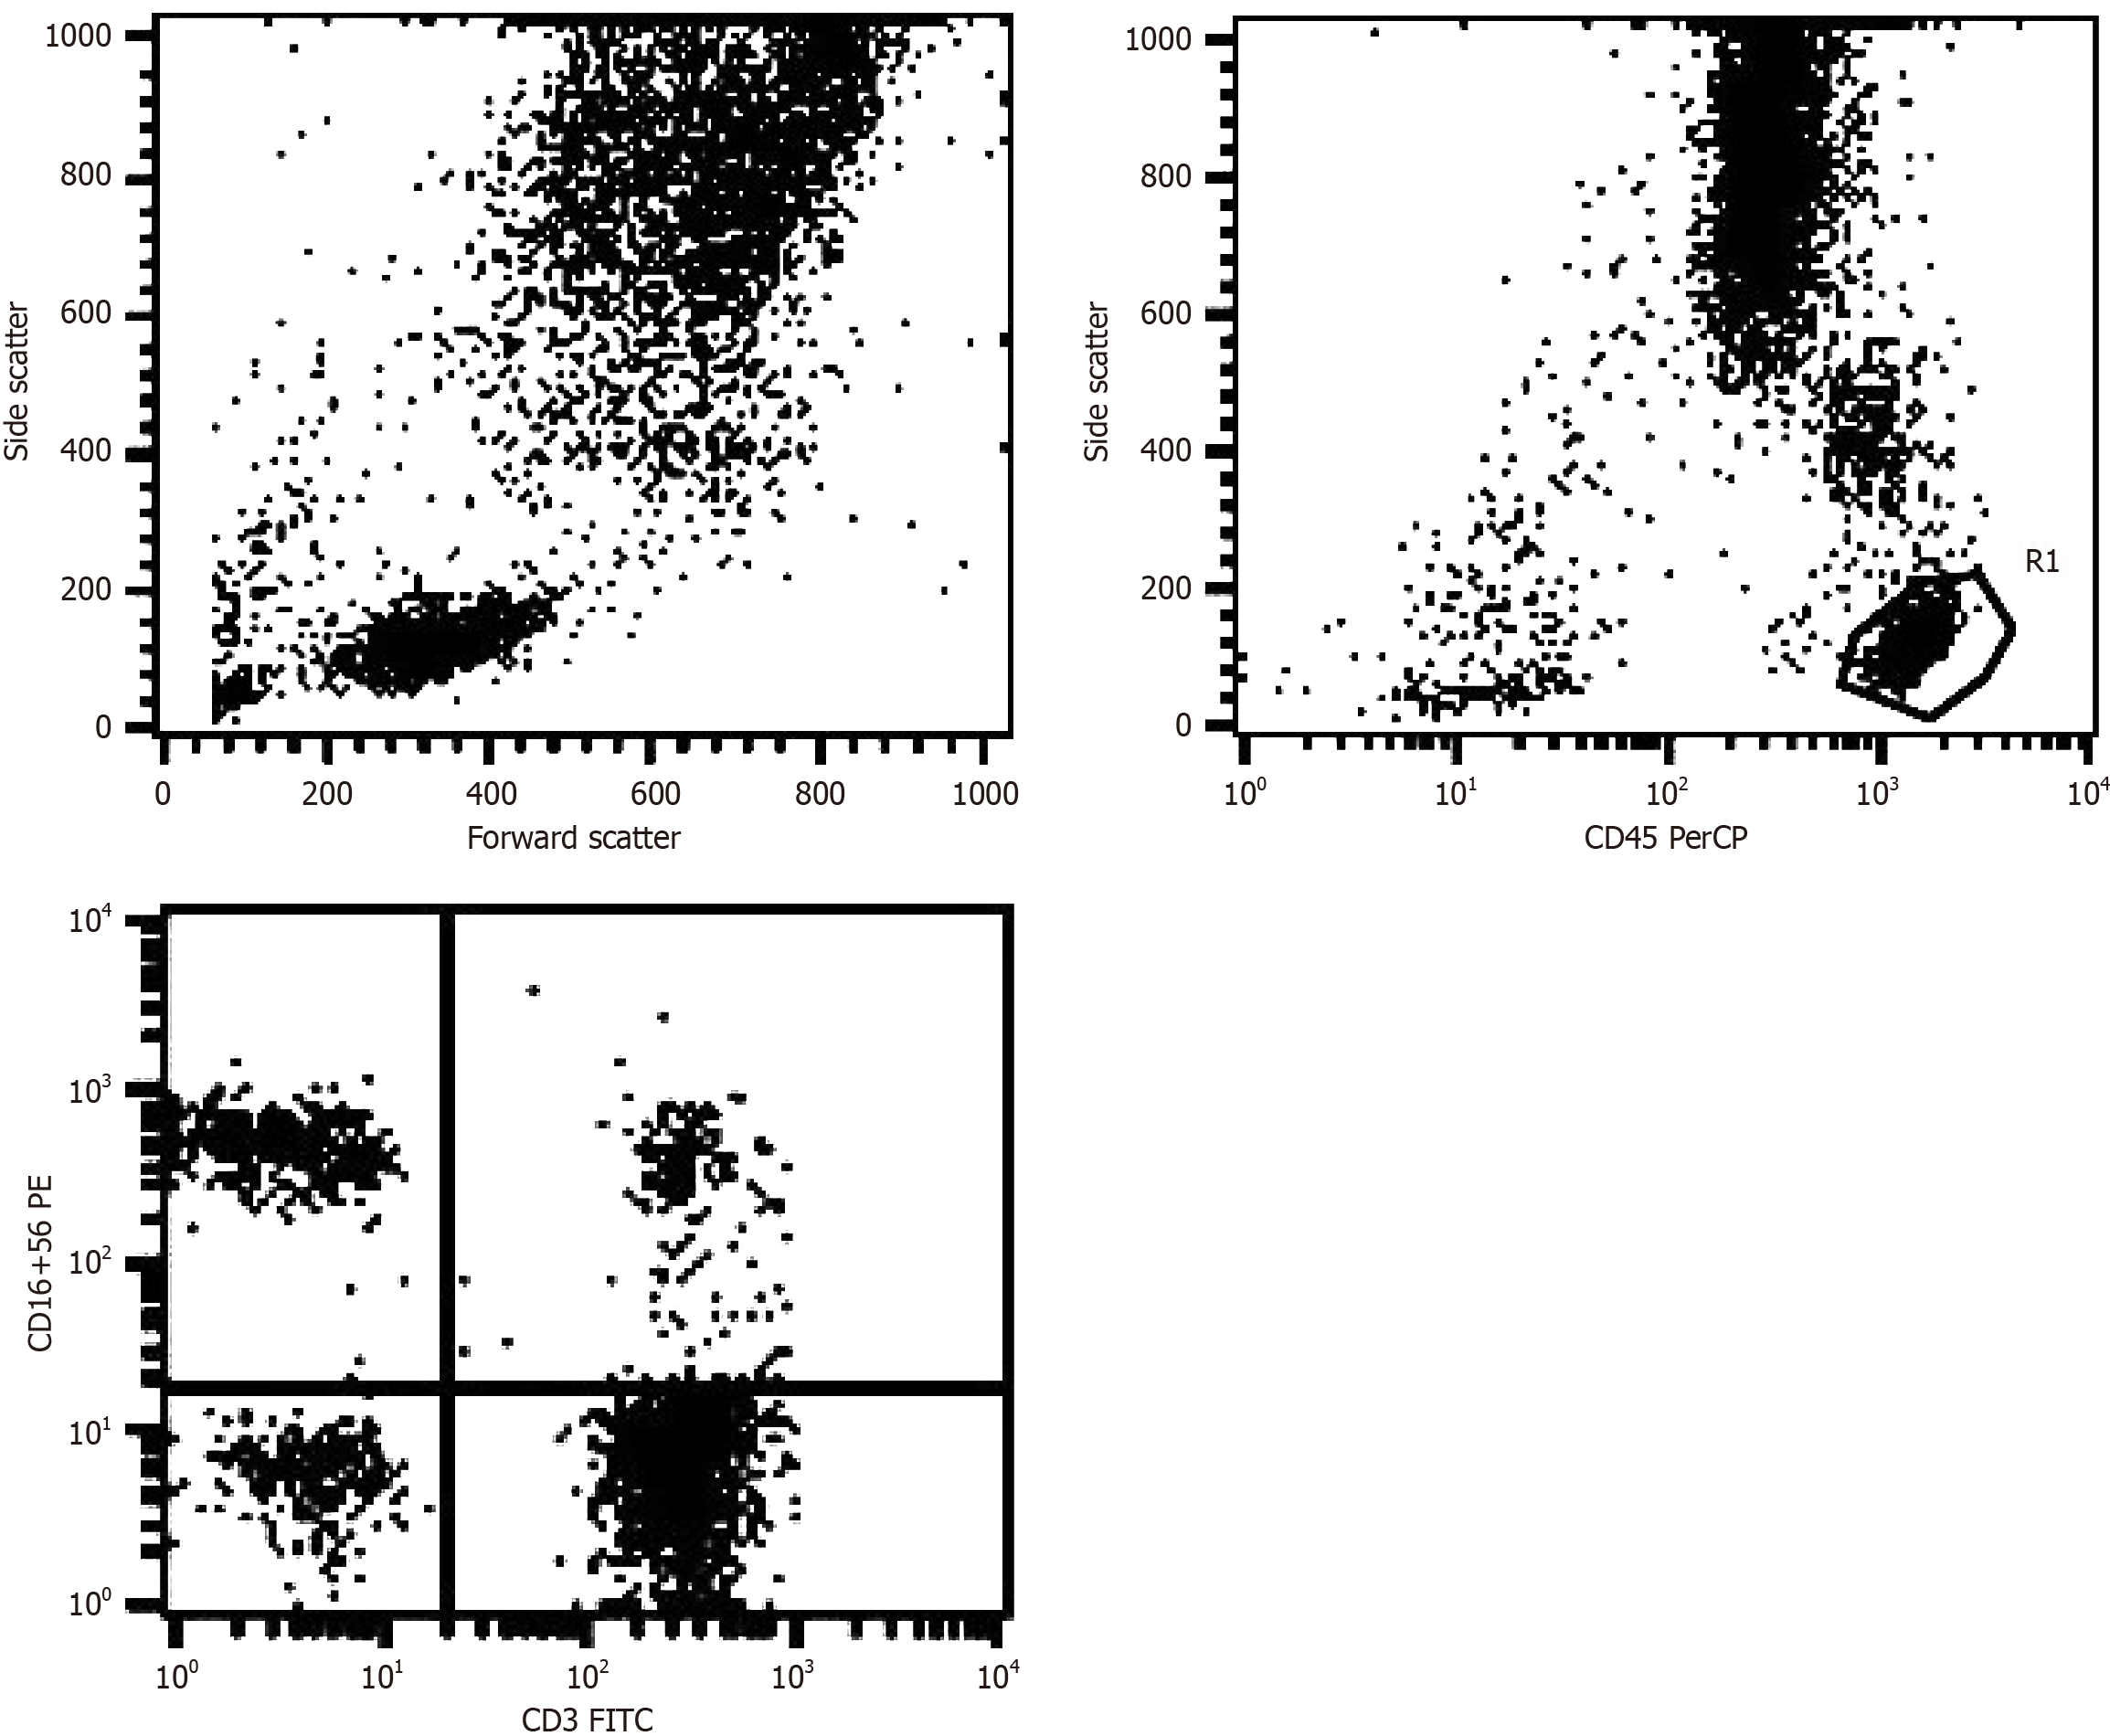
Figure 1 Natural killer and natural killer T cells gating strategy from representative histogram of flow cytometric analysis.
Graphs represented from left to right: Leukocyte population gating based on Side Scatter and Forward Scatter dot plot; leukocytes gating through Side Scatter and CD45; upper left quadrant represents CD3-CD16/CD56+ natural killer (NK) cell population. upper right quadrant represents CD3+CD16/CD56+ NKT cell population.
- Citation: Wang JF, Zhang LZ, Liu T, Meng QH, Mu JW, Wang YL. Natural killer cell dysfunction is associated with colorectal cancer with severe COVID-19. World J Gastrointest Oncol 2025; 17(5): 104591
- URL: https://www.wjgnet.com/1948-5204/full/v17/i5/104591.htm
- DOI: https://dx.doi.org/10.4251/wjgo.v17.i5.104591


