Copyright
©The Author(s) 2025.
World J Gastrointest Oncol. May 15, 2025; 17(5): 103479
Published online May 15, 2025. doi: 10.4251/wjgo.v17.i5.103479
Published online May 15, 2025. doi: 10.4251/wjgo.v17.i5.103479
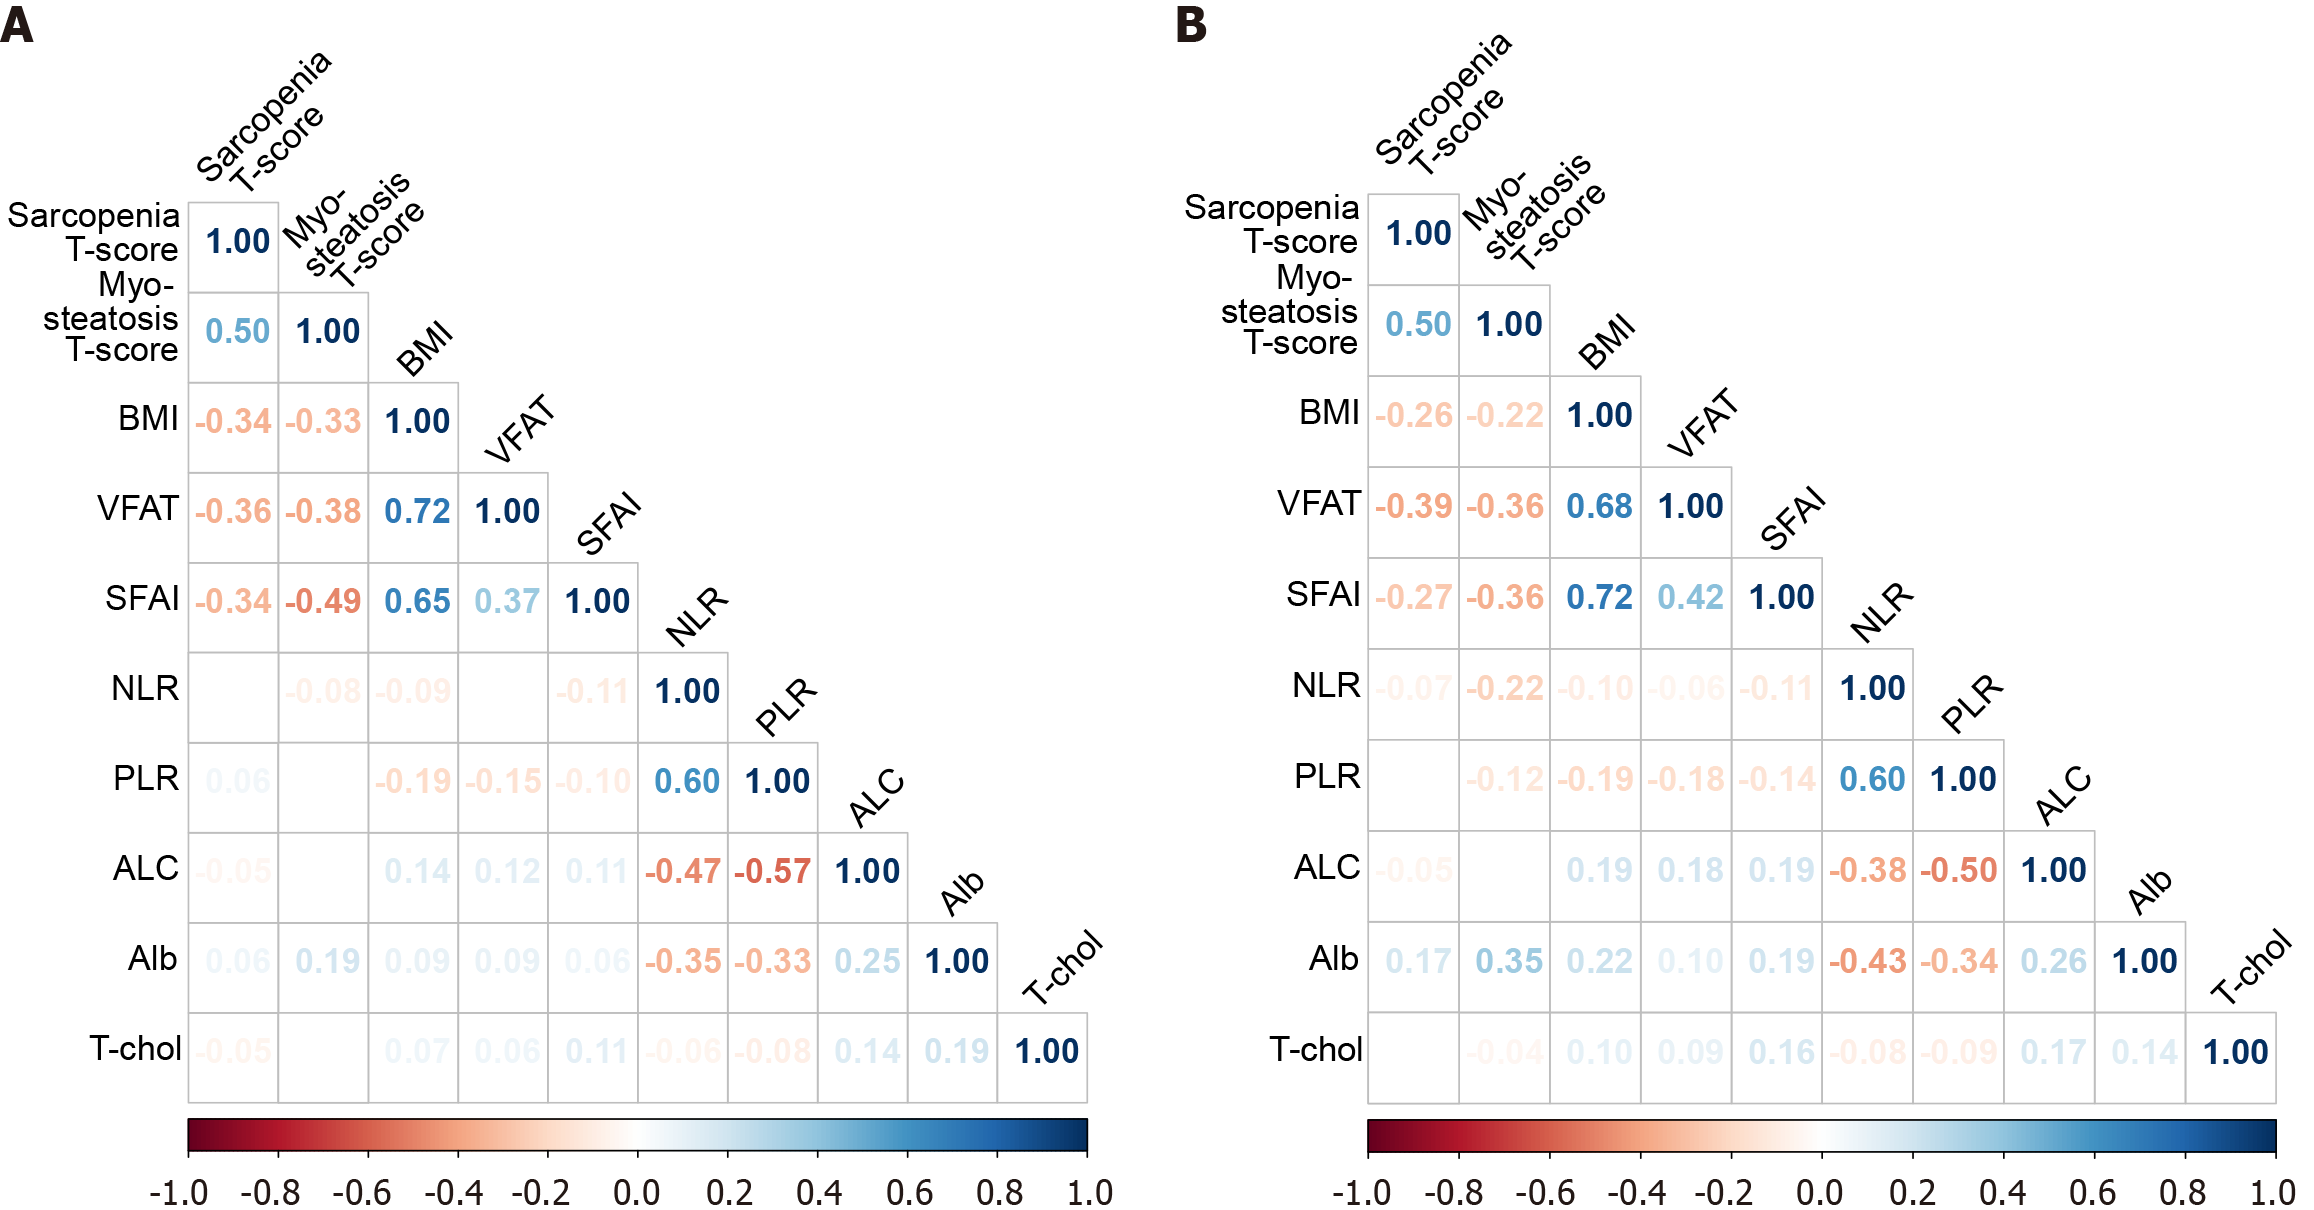
Figure 5 Correlation matrix at baseline, after the last systemic chemotherapy.
A: Correlation matrix at baseline; B: After the last systemic chemotherapy. The numbers shown are Pearson’s correlation coefficients with P values < 0.05. Negative and positive values indicate negative and positive correlations, respectively. Blanks indicate nonsignificant values. Alb: Albumin; ALC: Absolute lymphocyte count; BMI: Body mass index; NLR: Neutrophil-to-lymphocyte ratio; PLR: Platelet-to-lymphocyte ratio; SFAI: Subcutaneous fat area index; T-chol: Total cholesterol; VFA: Visceral fat area.
- Citation: Jeong H, Ko Y, Kim KW, Lee JS, Seo S, Kim SY, Hong YS, Kim JE, Kim TW. Longitudinal changes in body composition during palliative systemic chemotherapy and survival outcomes in metastatic colorectal cancer. World J Gastrointest Oncol 2025; 17(5): 103479
- URL: https://www.wjgnet.com/1948-5204/full/v17/i5/103479.htm
- DOI: https://dx.doi.org/10.4251/wjgo.v17.i5.103479


