Copyright
©The Author(s) 2025.
World J Gastrointest Oncol. Apr 15, 2025; 17(4): 103776
Published online Apr 15, 2025. doi: 10.4251/wjgo.v17.i4.103776
Published online Apr 15, 2025. doi: 10.4251/wjgo.v17.i4.103776
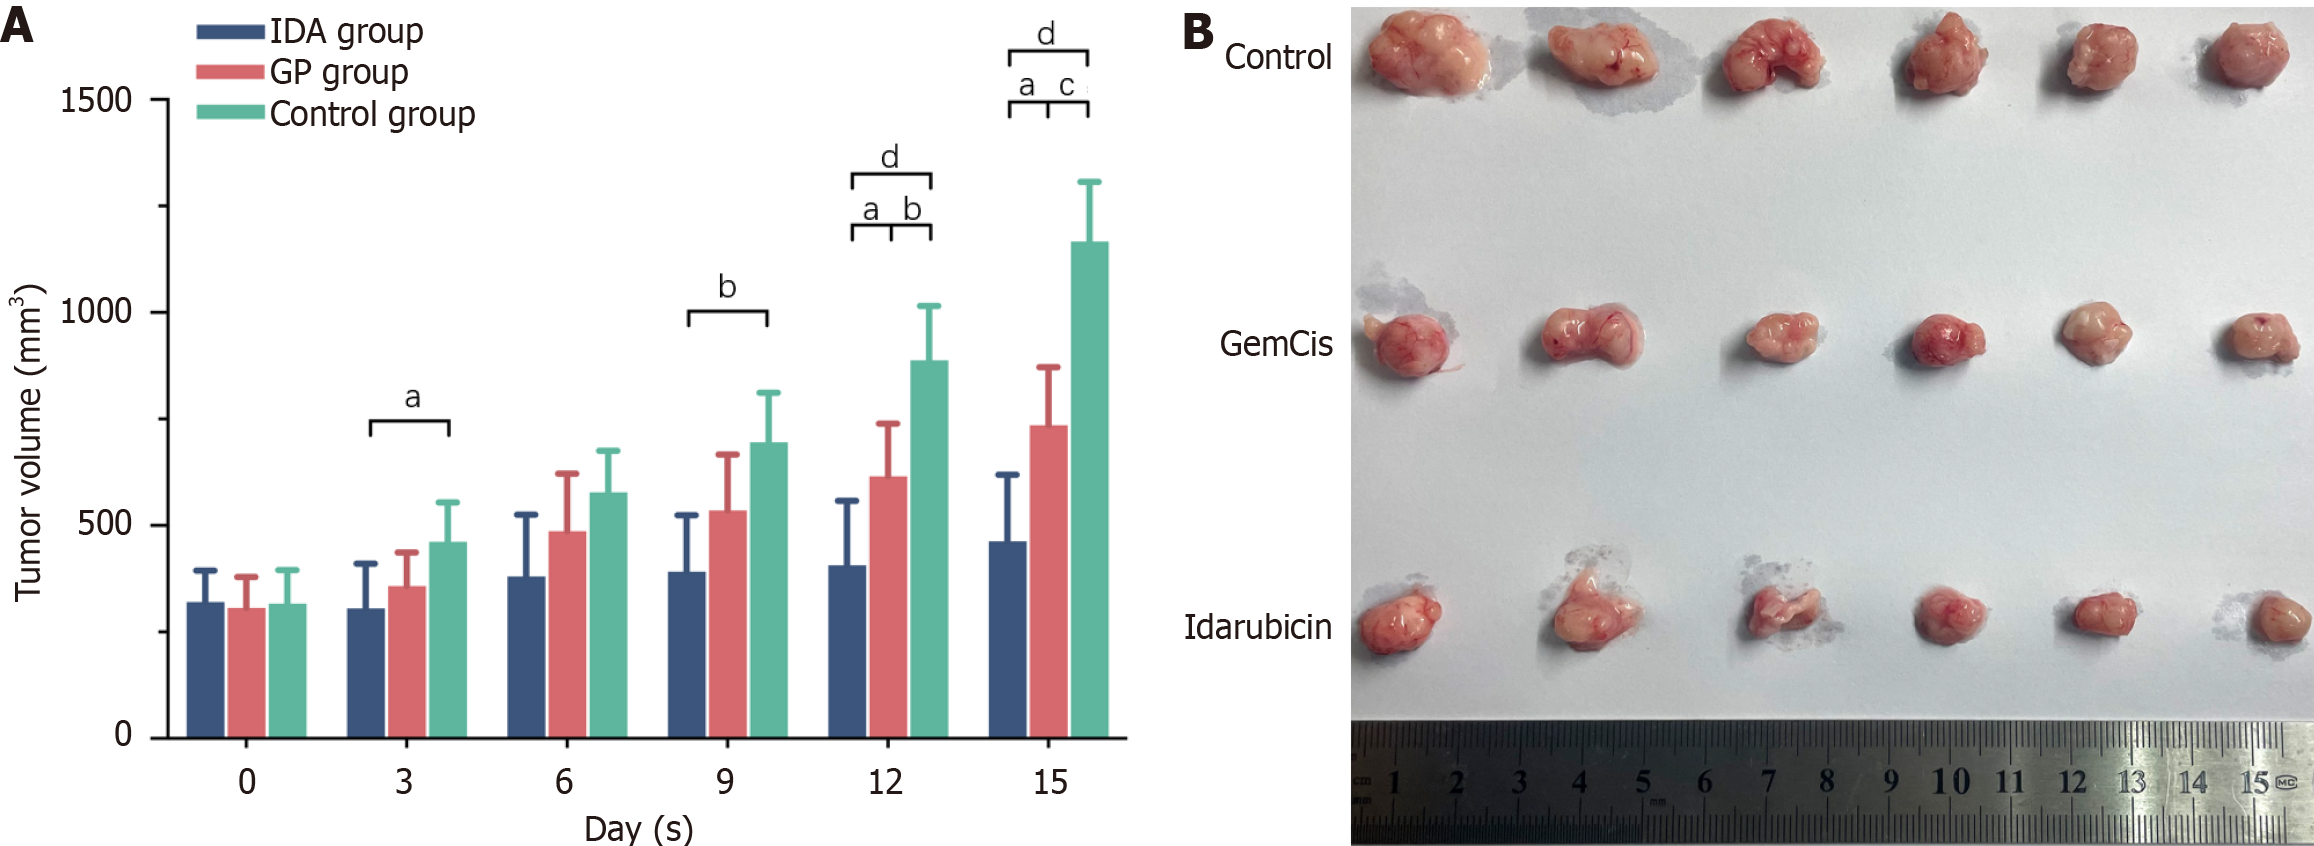
Figure 3 Effect of different treatment groups on tumor volume in tumor-bearing mice.
A: Bar graph showing tumor growth over 15 days; B: Images of excised tumors from mice in different treatment groups. aP < 0.05. bP < 0.01. cP < 0.001. dP < 0.0001. IDA: Idarubicin; GP: Gemcitabine and cisplatin.
- Citation: Zhao CH, Liu H, Pan T, Xiang ZW, Mu LW, Luo JY, Zhou CR, Li MA, Liu MM, Yan HZ, Huang MS. Idarubicin-transarterial chemoembolization combined with gemcitabine plus cisplatin for unresectable intrahepatic cholangiocarcinoma. World J Gastrointest Oncol 2025; 17(4): 103776
- URL: https://www.wjgnet.com/1948-5204/full/v17/i4/103776.htm
- DOI: https://dx.doi.org/10.4251/wjgo.v17.i4.103776


