Copyright
©The Author(s) 2025.
World J Gastrointest Oncol. Apr 15, 2025; 17(4): 102258
Published online Apr 15, 2025. doi: 10.4251/wjgo.v17.i4.102258
Published online Apr 15, 2025. doi: 10.4251/wjgo.v17.i4.102258
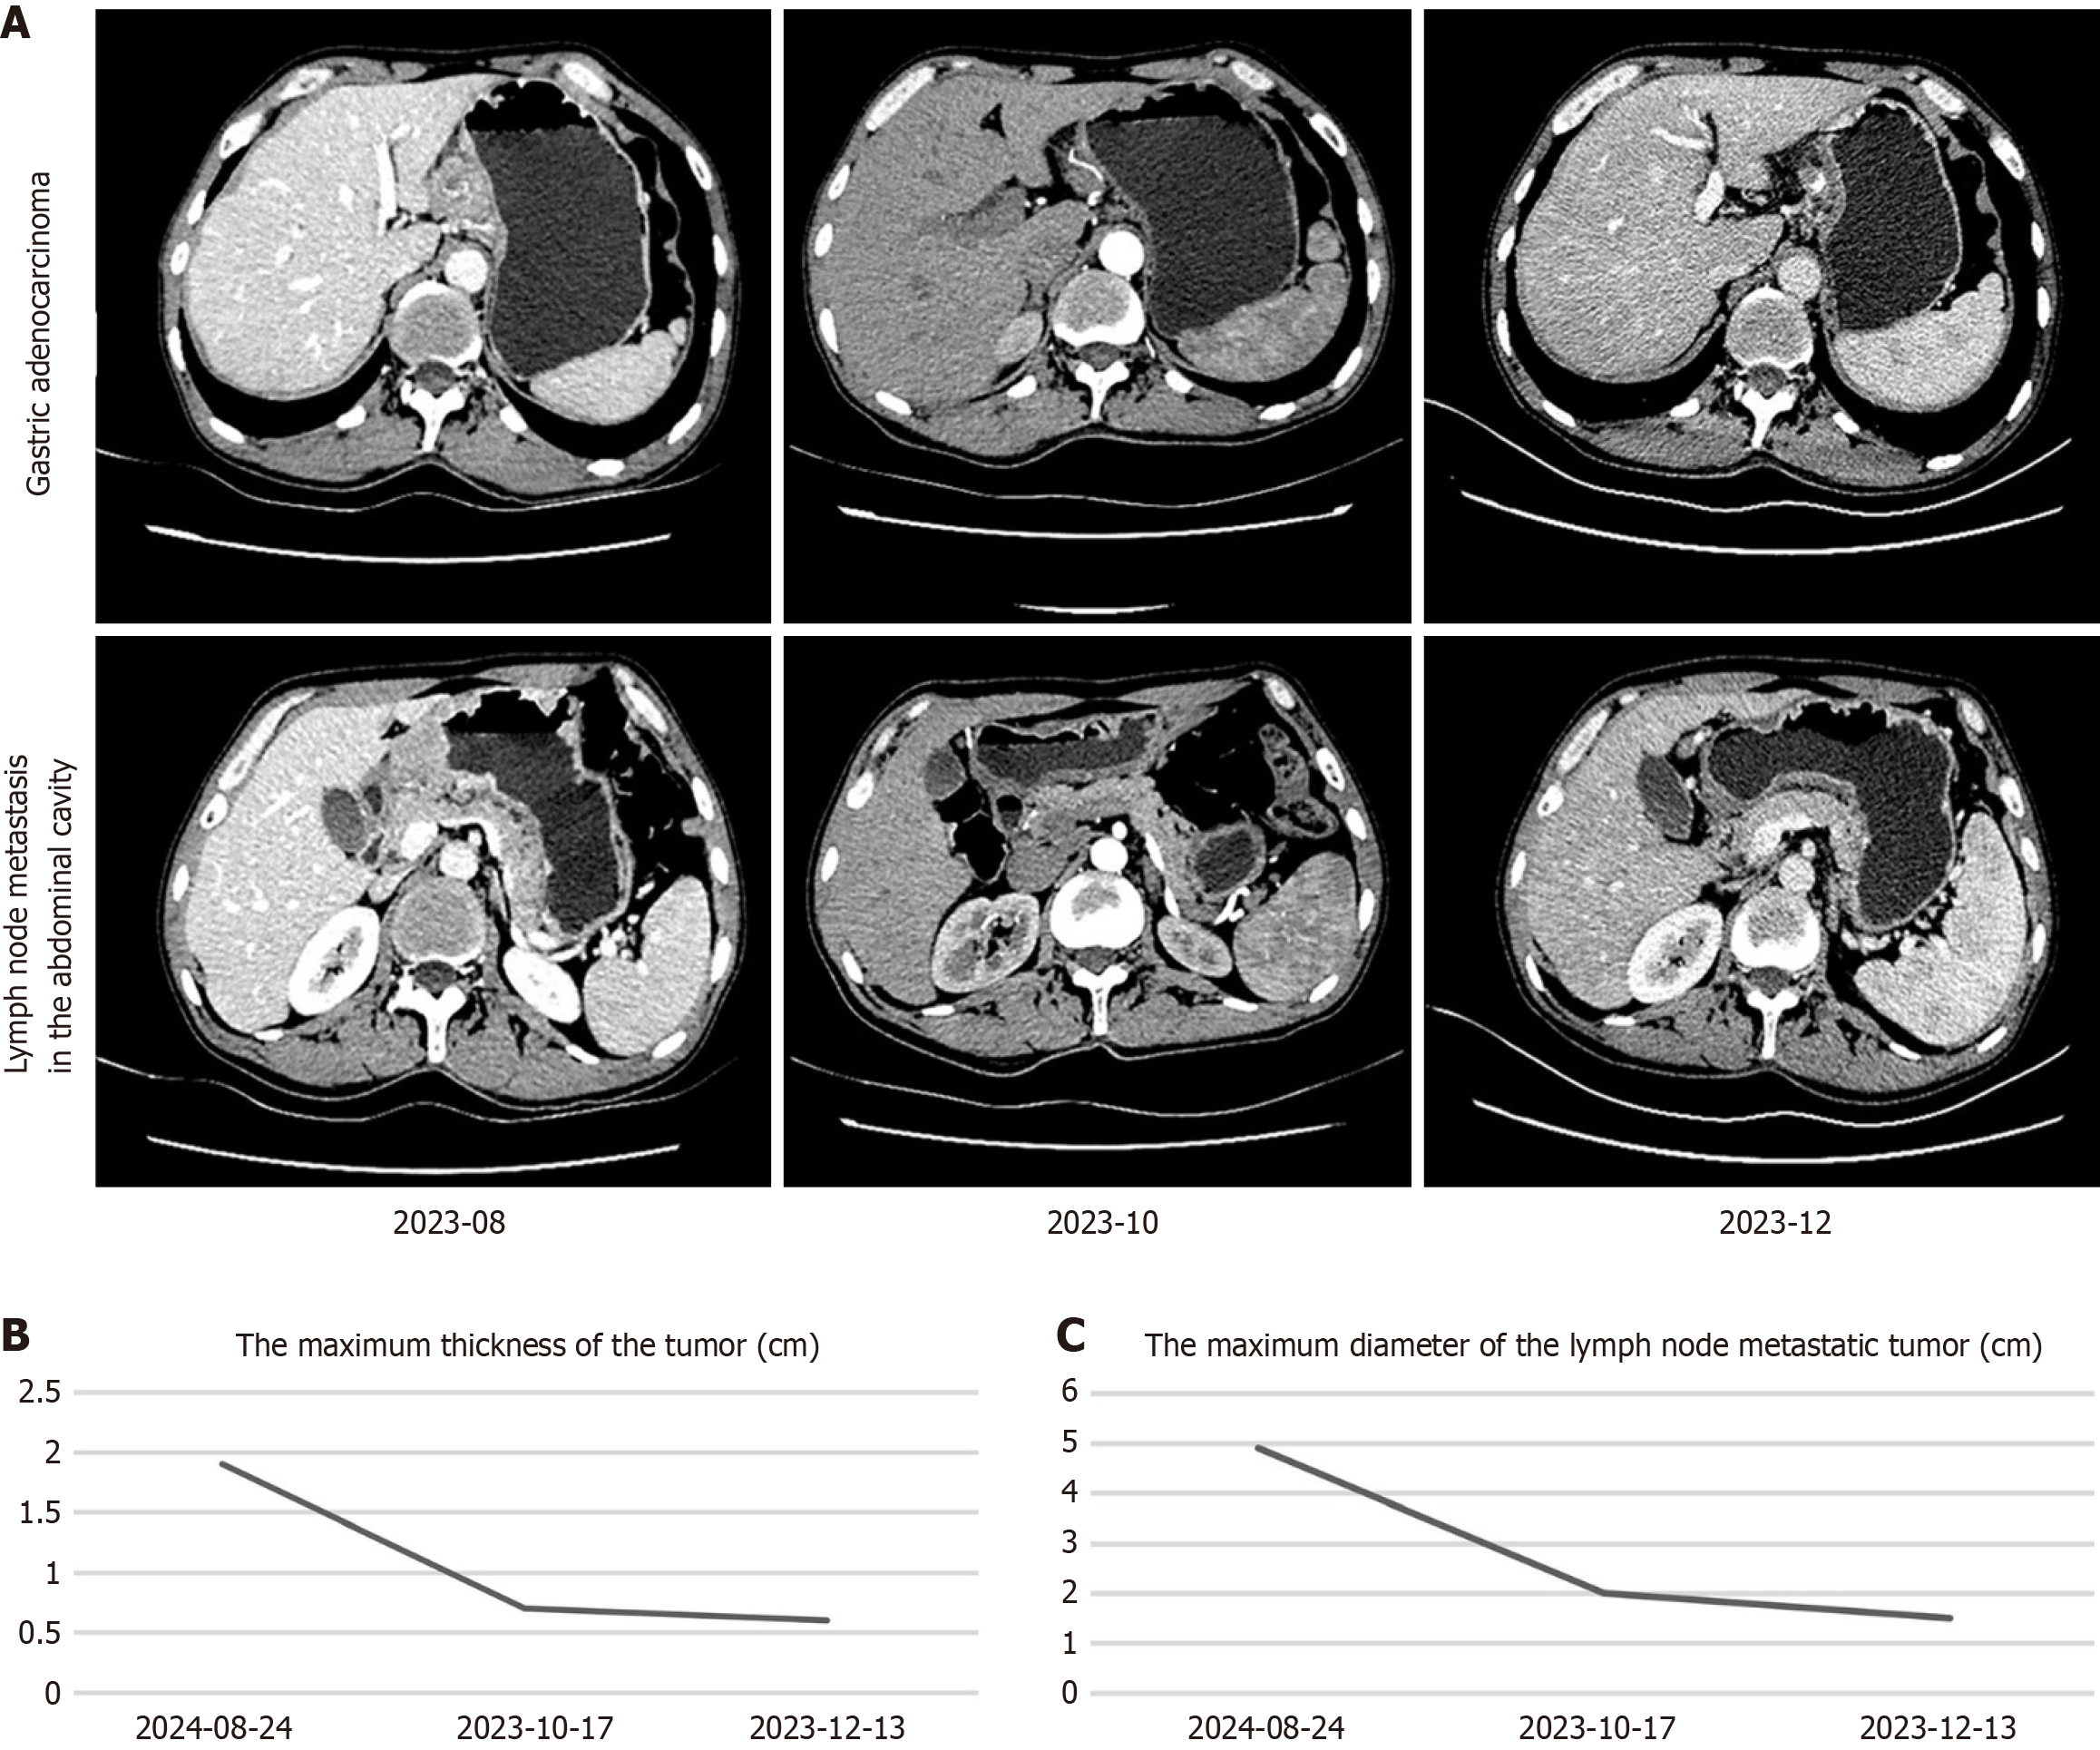
Figure 3 Enhanced abdominal computed tomography images for evaluating the treatment response.
A: Upper-row images show the changes in the size of the adenocarcinoma tumor tissue at the gastric body; Lower-row images show the changes in the size of the lymph node metastasis in the abdominal cavity; B: The maximum thickness of the tumor at the gastric body; C: The maximum diameter of the lymph node metastatic tumor.
- Citation: Du XY, Xia RJ, Shen LW, Ma JG, Yao WQ, Xu W, Lin ZP, Ma LB, Niu GQ, Fan RF, Xu SM, Yan L. Quadruple therapy with immunotherapy and chemotherapy as first-line conversion treatment for unresectable advanced gastric adenocarcinoma: A case report. World J Gastrointest Oncol 2025; 17(4): 102258
- URL: https://www.wjgnet.com/1948-5204/full/v17/i4/102258.htm
- DOI: https://dx.doi.org/10.4251/wjgo.v17.i4.102258


