
















©The Author(s) 2025.
World J Gastrointest Oncol. Dec 15, 2025; 17(12): 114037
Published online Dec 15, 2025. doi: 10.4251/wjgo.v17.i12.114037
Published online Dec 15, 2025. doi: 10.4251/wjgo.v17.i12.114037
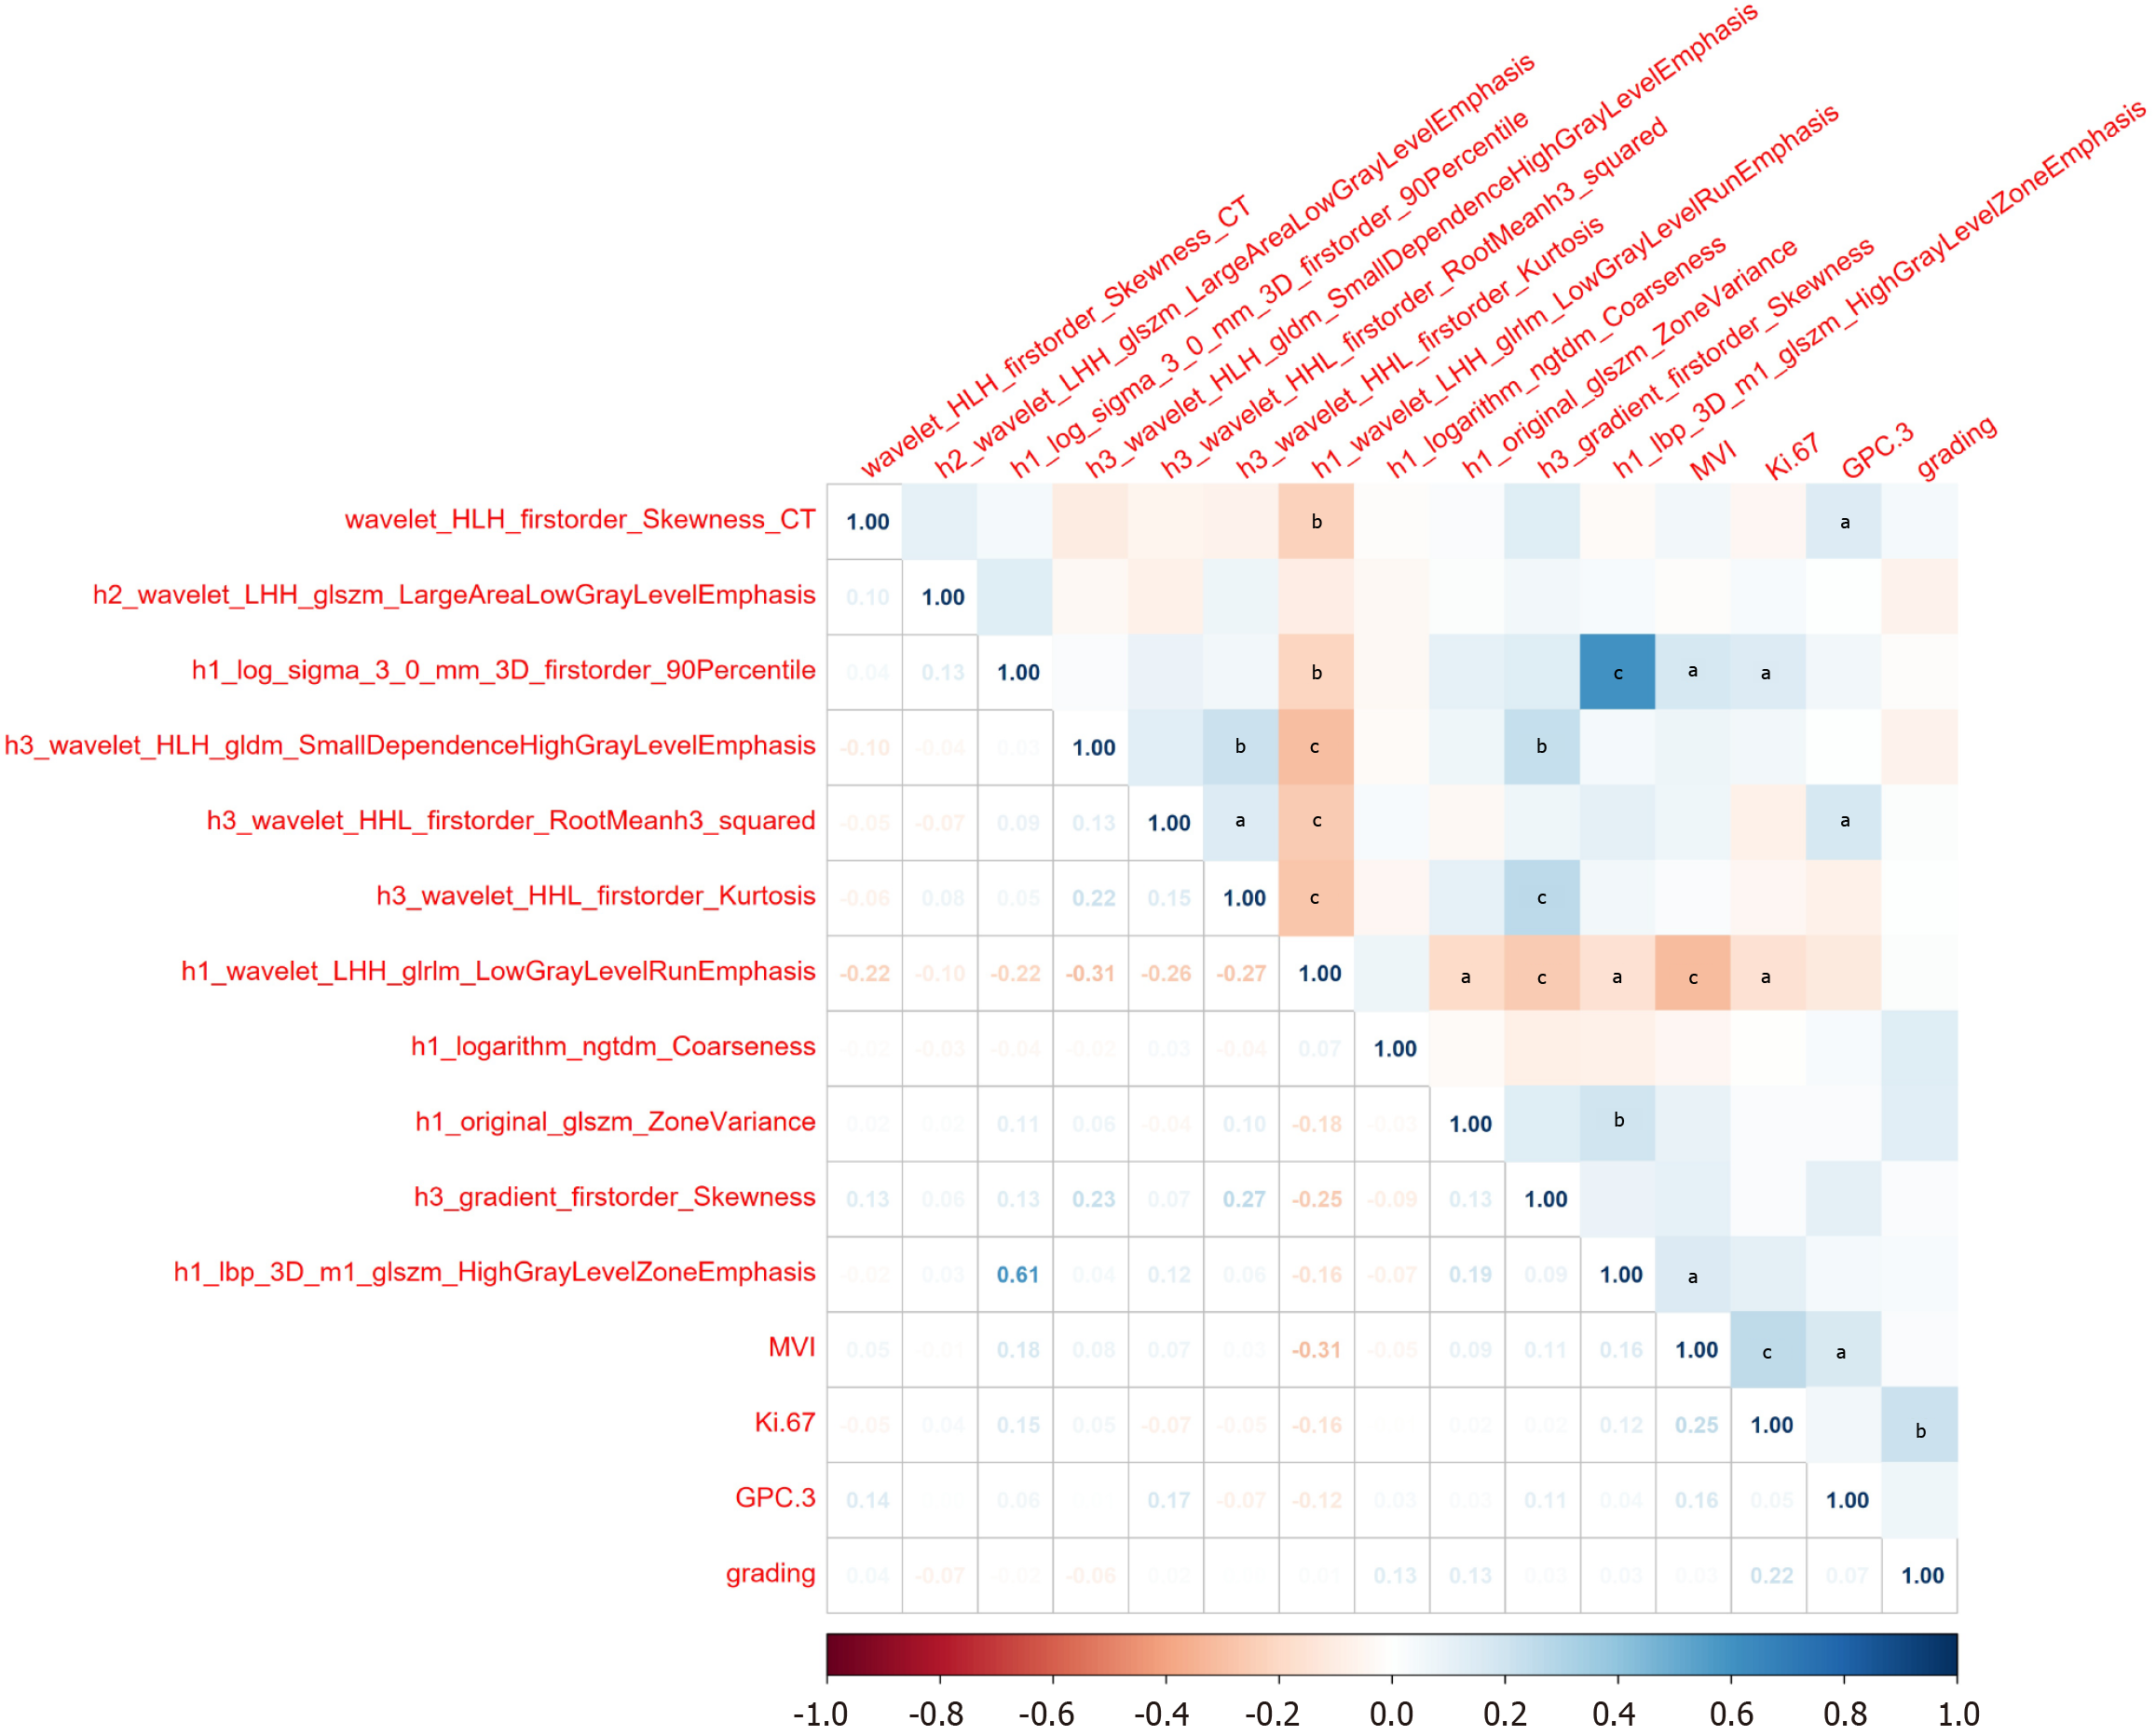
Figure 6 Correlation heatmap.
The numbers and colors within the squares indicate the correlation coefficients between variables, where warm colors (e.g., red) represent negative correlations and cool colors (e.g., blue) represent positive correlations. The deeper the color, the stronger the correlation. aP < 0.05; bP < 0.01; cP < 0.001. MVI: Microvascular invasion.
- Citation: Huang LH, Fang YJ, Zheng XJ, Huang C, Li CL, Yu B, Huang MJ, Qin SJ, Huang DY, Lu DW. Application of multimodal fusion technology in early recurrence prediction and pathological analysis of hepatocellular carcinoma. World J Gastrointest Oncol 2025; 17(12): 114037
- URL: https://www.wjgnet.com/1948-5204/full/v17/i12/114037.htm
- DOI: https://dx.doi.org/10.4251/wjgo.v17.i12.114037